 English
  Русский
 Bahasa Indonesia
 Bahasa Malay
 ไทย
ไทย Español
 Deutsch
 Български
 Français
 Tiếng Việt
 中文
中文 বাংলা
বাংলা हिन्दी
 Čeština
 Українська
 Română

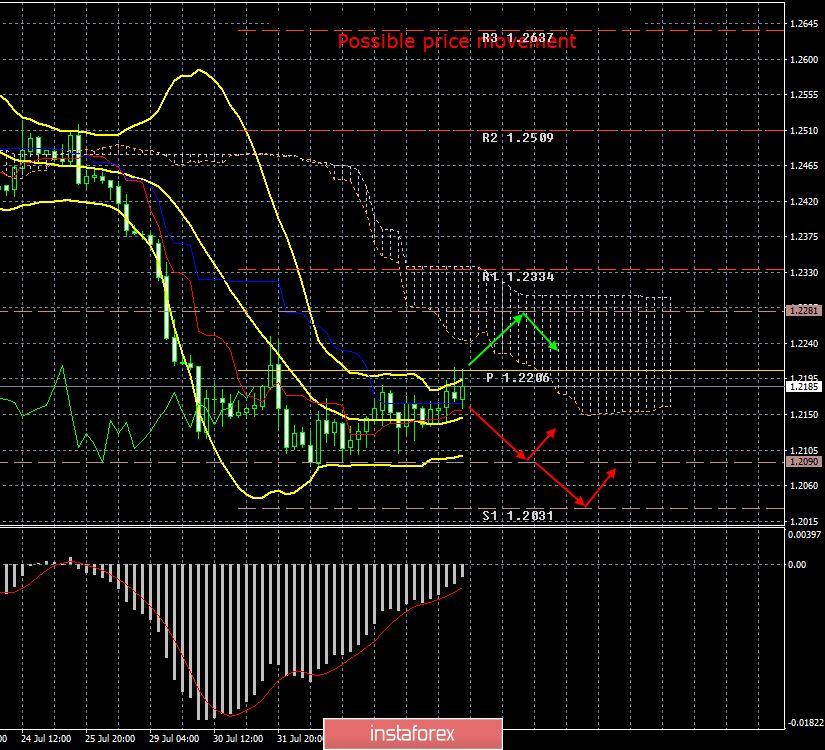
4-hour timeframe
Amplitude of the last 5 days (high-low): 106p - 116p - 91p - 80p - 86p.
Average amplitude over the last 5 days: 96p (113p).
The last few trading days can be called uniquely positive for the pound because new losses against the US dollar were avoided. There have been no particularly important messages in recent days regarding Brexit, nevertheless, the European Union has come to a very important conclusion for itself that Boris Johnson has no other plan than a "hard" Brexit. EU leaders are surprised that the new British prime minister has not yet contacted them and has not tried to make an appointment for dialogue on the new Brexit agreement. According to the European Union, Johnson wants serious concessions from Brussels, but he does not intend to make any concessions. Also, EU diplomats fear that this time the British Parliament will not be able to stop the implementation of the hard Brexit scenario. It was not reported as to how the Parliament deviates from its ideas. Thus, we are forced to state once again the fact: Great Britain is rushing at full speed towards the disordered Brexit, and the most ridiculous and paradoxical, it may not happen again if the Parliament blocks it. The British currency can only wish good luck. The pound will remain under pressure from traders until October 31, since the hard Brexit does not bode well for the UK economy. After October 31, everything will depend on whether the "divorce" between London and Brussels finally takes place or whether it will take another couple of years. In any case, three months is enough to make the pound drop more than once against the US currency. The pound/dollar is now in an open flat.
Trading recommendations:
The GBP/USD currency pair continues a corrective movement. Thus, it is now recommended to wait until a correction is completed and resume selling the pound with targets at levels of 1.2090 and 1.2031.
It will be possible to buy the British currency not earlier than when the pair consolidates above the critical line, but with extreme caution and in small lots. Ideally, the Bollinger Bands should be directed upwards. The target is 1.2281.
In addition to the technical picture, fundamental data and the time of their release should also be taken into account.
Explanation of the illustration:
Ichimoku indicator:
Tenkan-sen is the red line.
Kijun-sen is the blue line.
Senkou Span A - light brown dotted line.
Senkou Span B - light purple dashed line.
Chikou Span - green line.
Bollinger Bands Indicator:
3 yellow lines.
MACD indicator:
Red line and bar graph with white bars in the indicator window.