 English
  Русский
 Bahasa Indonesia
 Bahasa Malay
 ไทย
ไทย Español
 Deutsch
 Български
 Français
 Tiếng Việt
 中文
中文 বাংলা
বাংলা हिन्दी
 Čeština
 Українська
 Română

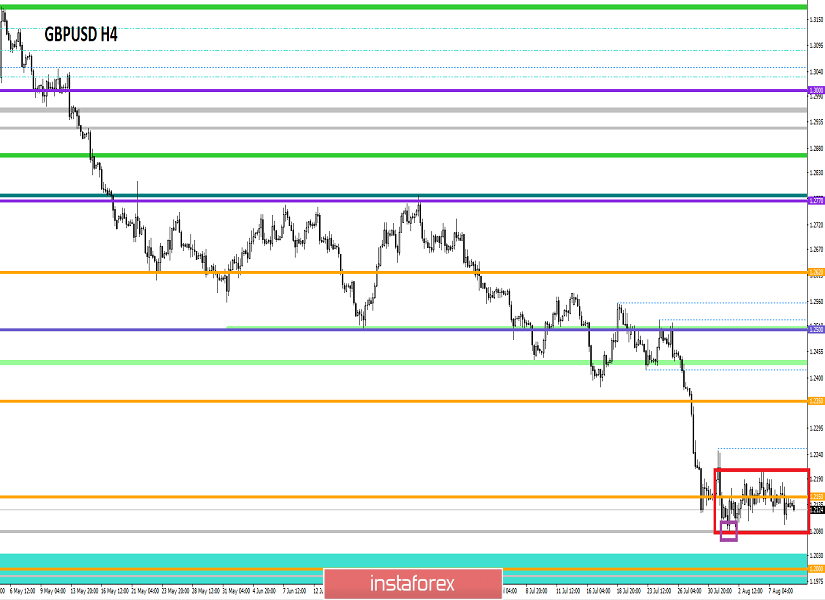
Over the past trading day, the pound / dollar currency pair showed a volatility equal to the average daily point of 87 points. However, nothing changed in terms of the movement itself - a flat horizontal move. From the point of view of technical analysis, we see the ideal accumulation, which can be cut and pasted into trading books. The price fluctuation within 1.2100-1.2200 with an error of +/- 20 points stretches already for the ninth day in a row, where indecision and ambiguity of actions draws attention to the situation more and more, which clearly will result in an uncontrolled, inertial jump.
As discussed in the previous review, traders holding short positions were already so late that, against the background of folding uncertainty, they entered the stage of partial and complete fixation of positions, waiting for the opening of consolidation and reverse entry to the market. Considering the trading chart in general terms (daily timeframe), we see that the global downward trend is in a variable stopping phase, drawing something similar to the graphical pattern of the continuation of the trend "Flag"on the market.
The news background of the past day was boring and passive, which practically nothing came of it. The only thing that can be highlighted is the applications for unemployment benefits in the United States, which, surprisingly, came out better than expected. The initial orders were revised and eventually reduced by 8 thousand, and the repeated ones were reduced by 15 thousand. If we synchronize the date of publication of applications and the trading chart, we see that, it turns out, not everything was so bad on the news flow, and the applications were locally supported American currency. Yet, the joy was short-lived, and the price rebound again, returning to the horizontal course.
The information background continues to stir the topic about the UK & EU divorce agreement. This time the head of the British Foreign Ministry, Dominic Raab, said during a visit to Mexico City that the EU should change the Brexit agreement, or the country would leave the EU without an agreement. In simple words, it all looks like jumping in place. In turn, British Prime Minister Boris Johnson is firmly convinced that the British Parliament will not resist the country's exit from the European Union on time. Johnson probably forgot that the parliament didn't mind quitting, but the majority was against a hard exit.
"Members of parliament must implement what they promised to the people of this country ... they will fulfill the 2016 mandate, and we will leave the EU on October 31, "Johnson said.
Boris Johnson also did not miss the moment, saying that Britain is ready to change migration laws, but without any specifics. Probably, a certain fear of the construction crisis that arose after Brexit due to a shortage of labor began to play in it.

Today, in terms of the economic calendar, we have a large package of statistics for the UK, which publishes a preliminary estimate of GDP for 2Q, and we are waiting for a slowdown in economic growth from 1.8% to 1.4%. At the same time, there will be data on industrial production in Britain, where there is also a decline, from 1.4% to -0.2%. In the afternoon, we are waiting for statistics on producer prices in the United States, where, according to preliminary forecasts, their level should remain unchanged at 1.7%.
The upcoming trading week in terms of the economic calendar is saturated with statistical data compared with the previous week, where, frankly, there was an empty sheet. Of course, in no case, we should not forget about the spontaneous information background. In this case, we are interested in the specifics of Brexit.
The most interesting events displayed below --->
Tuesday, August 13
Great Britain 8:30 Universal time. - Average wage level with bonuses (June): Prev 3.4% ---> Forecast 3.1%
Great Britain 8:30 Universal time. - Average salary excluding bonuses (June): Prev 3.6% ---> Forecast 3.5%
Great Britain 8:30 Universal time. - Unemployment Benefit Applications (July): Prev 38.0K ---> Forecast 22.8K
Great Britain 8:30 Universal time. - Unemployment Rate (June): Prev 3.8% ---> 3.8% forecast
USA 12:30 Universal time. - Core Consumer Price Index (CPI) (YoY) (July): Prev 2.1% ---> Forecast 2.1%
Wednesday, August 14
Great Britain 8:30 Universal time. - Consumer Price Index (CPI) (YoY) (July): Prev 2.0%
Great Britain 8:30 Universal time. - Core Retail Price Index (YoY) (July): Prev 2.8%
Thursday, August 15
Great Britain 8:30 Universal time. - Retail Sales (YoY) (July): Prev 3.8%
USA 12:30 Universal time. - Retail Sales (YoY): Prev 3.4% ---> Forecast 3.2%
USA 13:15 Universal time. - Industrial Production (YoY): Prev 1.3% ---> Forecast 1.2%
Friday, August 16
USA 12:30 Universal time. - Number of building permits issued (July): Prev 1.232M ---> Forecast 1.270M
USA 12:30 Universal time. - Volume of construction of new houses (July): Prev. 1.253M ---> Forecast 1.259M
Further development
Analyzing the current trading chart, we see that the horizontal movement of 1.2100-1.2200 (+/- 20p) is maintained in the market, more and more accumulating interest and fear of market participants. Traders are closely monitoring everything that happens, since this kind of accumulation is not so often, and its breakdown will definitely lead to an uncontrolled inertial move.
It is likely to assume that the amplitude fluctuation of 1.2100-1.2200 (+/- 20p) will continue to have a certain time, but now, you can actively analyze the possible move. The trading methodology in this case is "Work on the breakdown of borders", where clear price fixations are analyzed, preferably with the inertial course and pressure of the information and news background.
Based on the available information, it is possible to expand a number of variations, let's specify them:
- Positions to buy are considered in case of clear price fixing higher than 1.2220 (not a puncture). The prospect of 1.2250 --- 1.2350.
- Positions to sell are considered in case of a clear price fixing lower than 1.2080, with a breakdown of the local minimum and a move to the psychological level of 1.2000. The further course is already being considered with respect to the level of 1.2000 and fixation points.
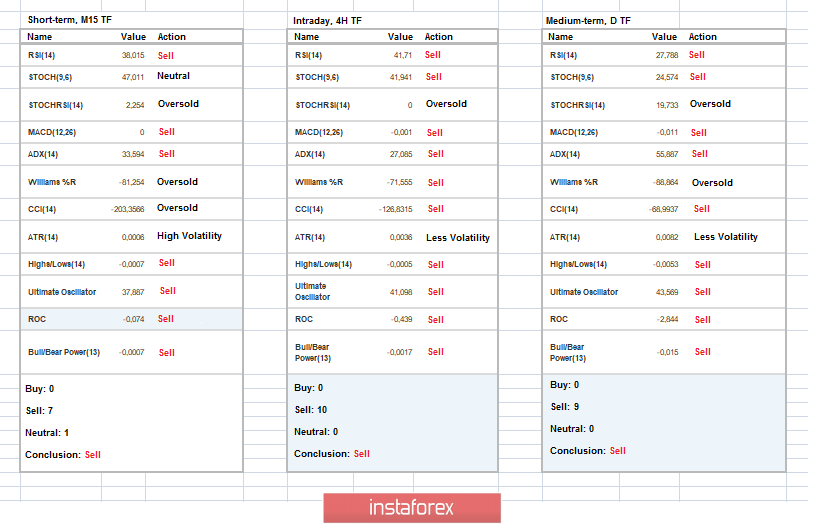
Indicator analysis
Analyzing a different sector of timeframes (TF), we see that the indicators at all time intervals signal a downward interest. It is worth considering such a moment that while we are within the boundaries of the cluster. The indicators in the short-term and intraday are variable.
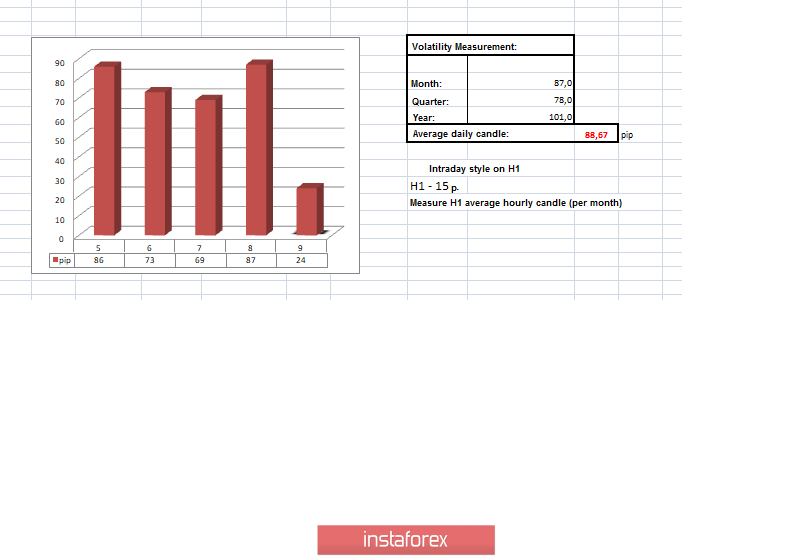
Volatility per week / Measurement of volatility: Month; Quarter; Year
Measurement of volatility reflects the average daily fluctuation, calculated for the Month / Quarter / Year.
(August 9 was built taking into account the time of publication of the article)
The current time volatility is 24 points, which is suspiciously low value for this time section. The volatility of the day will depend on the current cluster, since in case of breakdown it can increase many times.
Key levels
Resistance zones: 1.2150 **; 1.2350 **; 1.2430; 1.2500; 1.2620; 1.2770 **; 1.2880 (1.2865-1.2880) *; 1.2920 * 1.3000 **; 1.3180 *; 1.3300
Support areas: 1.2150 **; 1,2000; 1.1700; 1.1475 **
* Periodic level
** Range Level
*** The article is built on the principle of conducting a transaction, with daily adjustment