 English
  Русский
 Bahasa Indonesia
 Bahasa Malay
 ไทย
ไทย Español
 Deutsch
 Български
 Français
 Tiếng Việt
 中文
中文 বাংলা
বাংলা हिन्दी
 Čeština
 Українська
 Română

GBP/USD
Investors did not wait patiently for several days on Friday for the British economy – they were even worse than the weak forecasts themselves. GDP for the 2nd quarter amounted to -0.2% against the forecast of 0.0%, industrial production for June decreased by 0.1%, the trade balance for June showed an improvement from -10.7 billion pounds to -7.0 billion, but the quarterly trade balance data showed a reduction in exports by 1.5% and a reduction in imports by 13.0%, which completely negates the formally positive figure for June. The British media immediately started talking about the "wandering ghost of the recession." The pound fell by 103 points, reaching the target level of 1.2032.
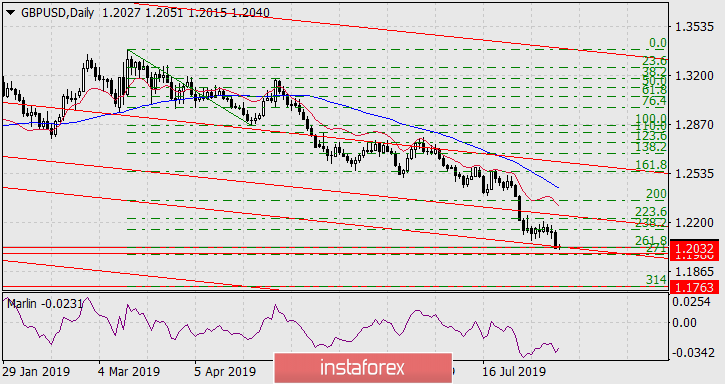
The daily chart implies that fixing the price under the range of 1.1986-1.2032 opens up the prospect of reduction to 1.1763 – the Fibonacci level of 314.0% of the March 13-April 25 branch.
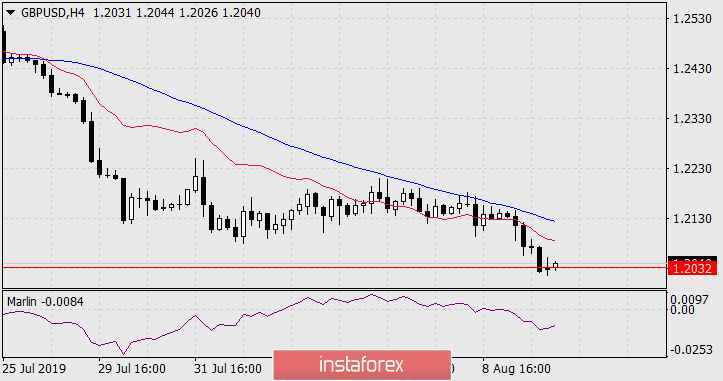
As seen on the four-hour chart, the price decreases below the indicator lines of the balance and MACD, the signal line of the Marlin oscillator also quickly deepens into the zone of the falling trend. We are waiting for the development in this "bearish" channel, but later, on Tuesday, as the price needs to settle on technical support, and tomorrow in the UK, there are data on employment for June (the forecast of growth in the number of unemployed from 38.0 tho