 English
  Русский
 Bahasa Indonesia
 Bahasa Malay
 ไทย
ไทย Español
 Deutsch
 Български
 Français
 Tiếng Việt
 中文
中文 বাংলা
বাংলা हिन्दी
 Čeština
 Українська
 Română

Trend analysis (Fig. 1).
Today, the pair will try again to break down the support line 1.1065 (yellow dashed line), but this will most likely happen after lunch. Before lunch (9.00 Universal time), the price will move up, with the target of 1.1094 - a pullback level of 14.6% (yellow dashed line).
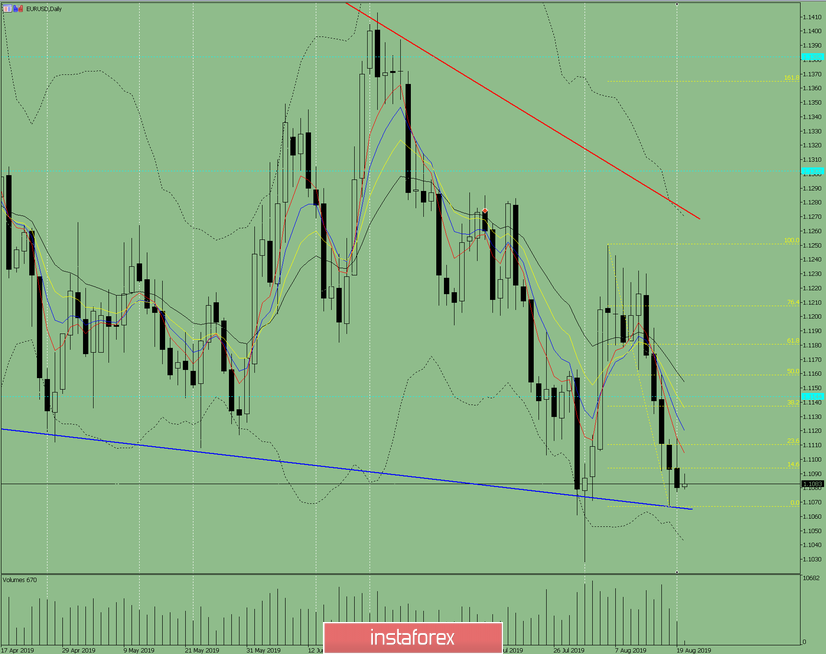
Fig. 1 (daily chart).
Comprehensive analysis:
- indicator analysis - down;
- Fibonacci levels - up;
- volumes - up;
- candlestick analysis - up;
- trend analysis - up;
- Bollinger Lines - down;
- weekly schedule - down.
General conclusion: up.
The scenario with a low probability is an upward movement with the first target of 1.1115 - an upper fractal.