 English
  Русский
 Bahasa Indonesia
 Bahasa Malay
 ไทย
ไทย Español
 Deutsch
 Български
 Français
 Tiếng Việt
 中文
中文 বাংলা
বাংলা हिन्दी
 Čeština
 Українська
 Română

On Tuesday, the pair will continue to move upward, but after lunch. Before lunch, there will be a downward movement with the target of the lower fractal - 1.2104. On Monday, moving up, the price was not able to break through the 13th average EMA - 1.2143 and rolled back down. Strong calendar news is not expected on Tuesday.
Trend analysis (Fig. 1).
On Tuesday, the price will continue to move up, with the first target at 1.2215 - a pullback level of 14.6% (yellow dashed line).
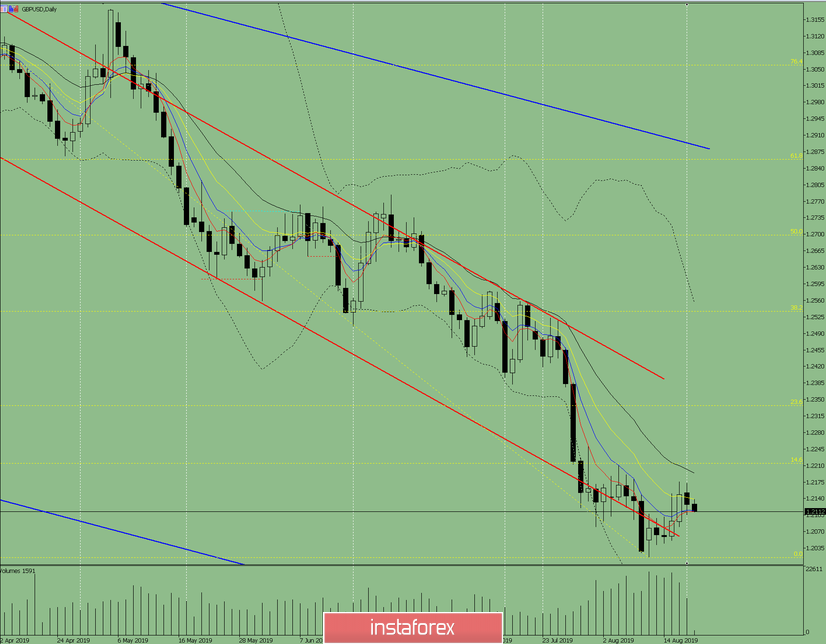
Fig. 1 (daily chart).
Comprehensive analysis:
- indicator analysis - up;
- Fibonacci levels - up;
- volumes - up;
- candlestick analysis - down;
- trend analysis - up;
- Bollinger Lines - down;
- weekly schedule - up.
General conclusion:
On Tuesday, the price will continue to move up.
The scenario of the lower movement is unlikely, but we will consider it. When moving down, the first lower target of 1.2037 is the support line (red bold line).