 English
  Русский
 Bahasa Indonesia
 Bahasa Malay
 ไทย
ไทย Español
 Deutsch
 Български
 Français
 Tiếng Việt
 中文
中文 বাংলা
বাংলা हिन्दी
 Čeština
 Українська
 Română

On Tuesday, the pair moved down, failed to reach the resistance line – 1.2037 (red bold line), and after that, the price went up. On Wednesday, the pair will try to continue moving up. Strong calendar news is expected at 15:00 London time, 15:30 London time, and 19:00 London time (dollar).
Trend analysis (Fig. 1).
On Wednesday, the price may continue to move up with the first target of 1.2192 – 21 average EMA (black thin line).
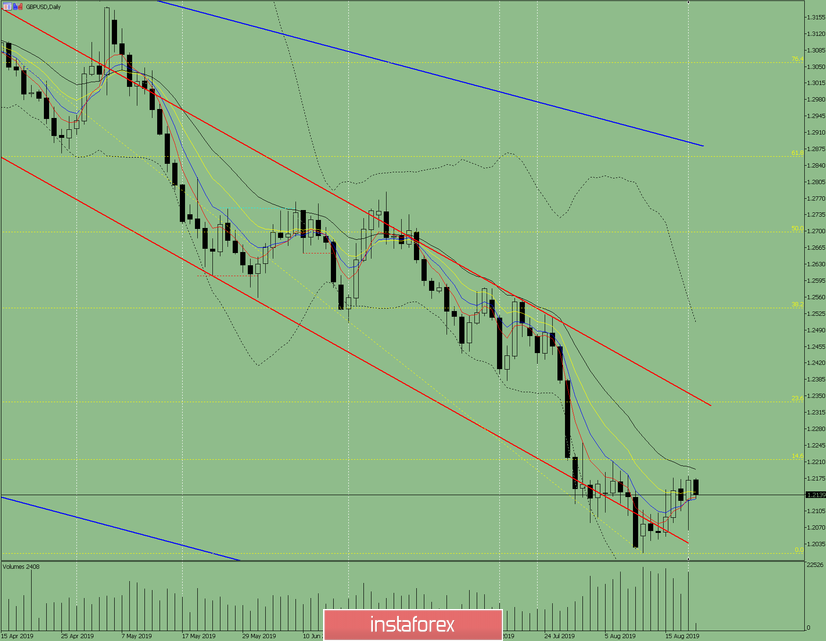
Fig. 1 (daily chart).
Complex analysis:
- Indicator analysis – down;
- Fibonacci levels – up;
- Volumes – up;
- Candle analysis – up;
- Trend analysis – down;
- Bollinger bands – down;
- Weekly schedule - up.
General conclusion:
On Wednesday, the price may continue to move up with the first target of 1.2192 – 21 average EMA (black thin line).
Unlikely scenario: a downward movement with target of 1.2064 – lower fractal.