 English
  Русский
 Bahasa Indonesia
 Bahasa Malay
 ไทย
ไทย Español
 Deutsch
 Български
 Français
 Tiếng Việt
 中文
中文 বাংলা
বাংলা हिन्दी
 Čeština
 Українська
 Română

Trend analysis (Fig. 1).
On Thursday, the price may continue to move up, with the target of reaching 21 average EMA - 1.2193 (black thin line).
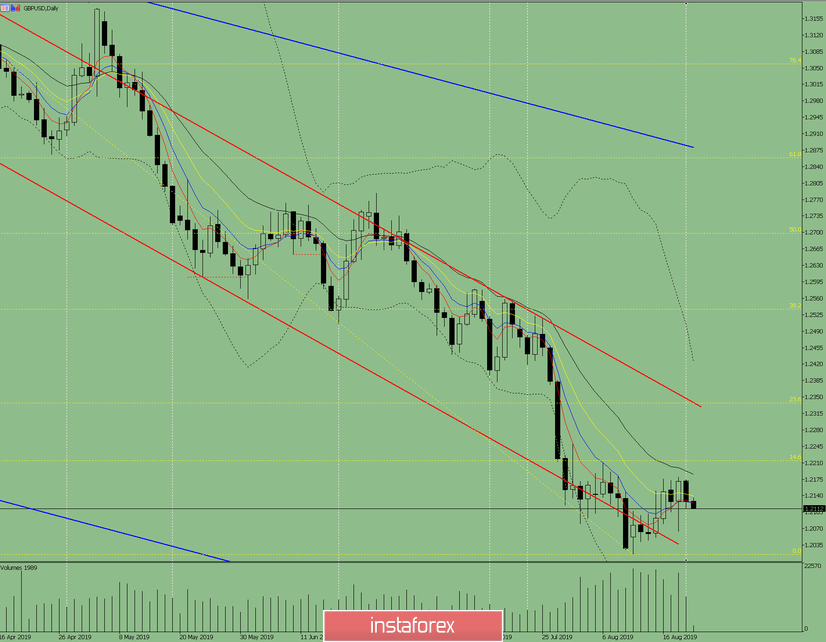
Fig. 1 (daily chart).
Comprehensive analysis:
- indicator analysis - up;
- Fibonacci levels - up;
- volumes - up;
- candlestick analysis - neutral;
- trend analysis - up;
- Bollinger Lines - down;
- weekly schedule - down.
General conclusion:
On Thursday, the price may continue to move up.
An unlikely scenario is a downward movement with the target 1.2064 - lower fractal.