 English
  Русский
 Bahasa Indonesia
 Bahasa Malay
 ไทย
ไทย Español
 Deutsch
 Български
 Français
 Tiếng Việt
 中文
中文 বাংলা
বাংলা हिन्दी
 Čeština
 Українська
 Română

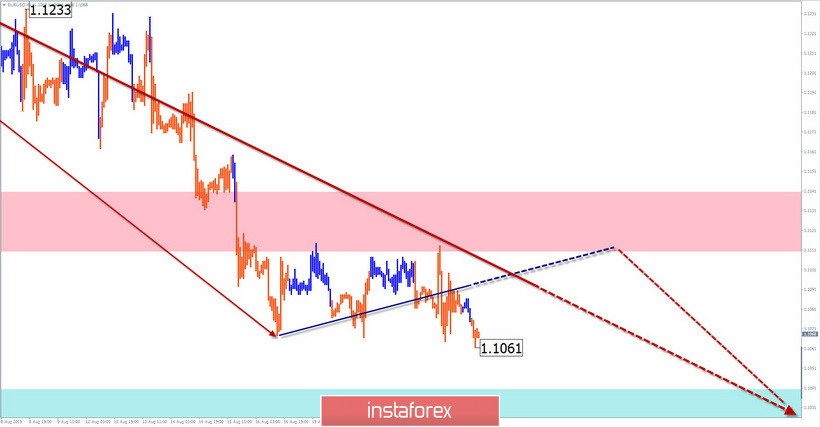
EUR/USD
The unfinished short-term wave structure on the euro chart is ascending, from August 1. Over the past 2 weeks, the price has formed the middle part of B. The price that has reached intermediate support has formed a sideways pattern.
Forecast:
The flat section of the chart formed this week does not have a reversal potential, so the price decline will continue. The next line of likely completion is the support zone. At the next trading session, there is a high probability of a short-term rise to the resistance zone.
Recommendations:
When buying euros today, it is more reasonable to reduce the lot. In the area of the resistance zone, it is recommended to monitor the pair's sell signals. When the price approaches the support zone, it is necessary to close sell trades at the first reversal signals.
Resistance zone:
- 1.1110/1.1140
Support zone:
- 1.1040/1.1010
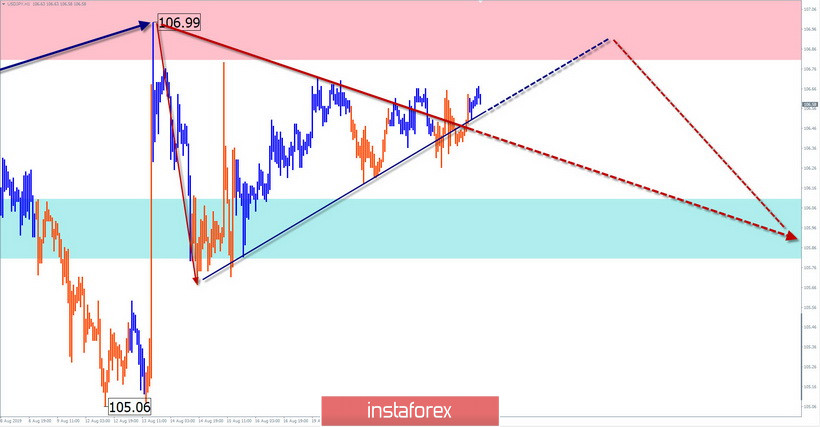
USD/JPY
To determine the short-term prospects of the Japanese yen, the most interesting is the last bearish wave of August 13. The first part of the wave showed a reversal potential. In the side view that begins further, the correction part B of the corresponding first part of the level wave is formed.
Forecast:
Today, the continuation of the flat mood of the movement of recent days is expected, mainly with an upward vector. By the end of the day, the probability of a reversal and the beginning of a price decline increases.
Recommendations:
Buying a pair is possible today, but it is worth considering the limitations of the expected move up. Before the appearance of clear signals of a reversal, the pair is risky. After their appearance, you should look at the sales of the tool.
Resistance zone:
- 106.80/107.10
Support zone:
- 106.10/105.80
Explanations to the figures: Waves in the simplified wave analysis consist of 3 parts (A-B-C). The last unfinished wave is analyzed. Zones show areas with the highest probability of reversal. The arrows indicate the wave marking according to the method used by the author, the solid background is the formed structure, the dotted ones are the expected movements.
Attention: The wave algorithm does not take into account the length of time the instrument moves.