 English
  Русский
 Bahasa Indonesia
 Bahasa Malay
 ไทย
ไทย Español
 Deutsch
 Български
 Français
 Tiếng Việt
 中文
中文 বাংলা
বাংলা हिन्दी
 Čeština
 Українська
 Română

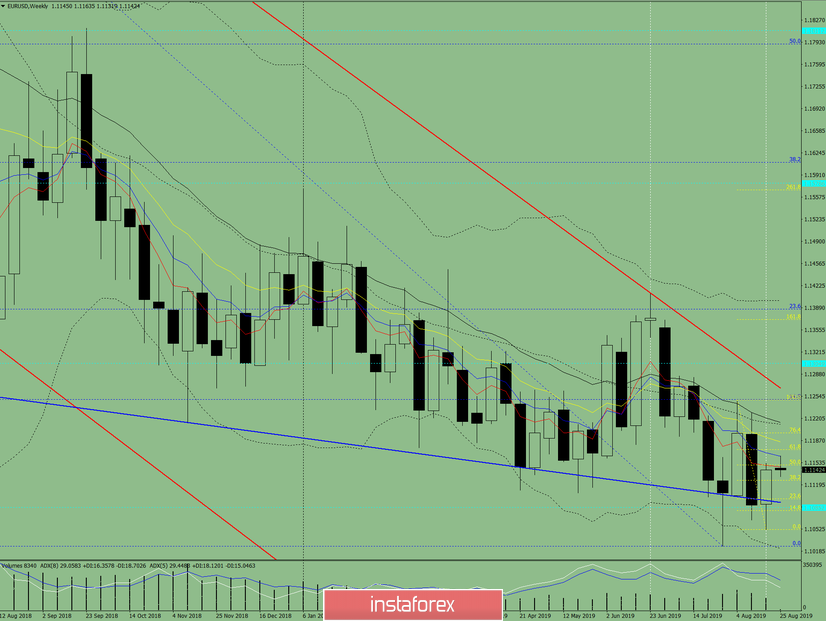
Last week, the pair made an upward movement, breaking off the support line of 1.1095 (blue bold line). The price tested a pullback level of 50% - 1.1150 (yellow dotted line). This week, there is a high probability of continuing the upward movement.
Trend analysis.
This week, the price will move up with the first target of 1.1173 – a retracement level of 61.8% (yellow dotted line), when it reaches further a retracement level of 76.4% - 1.1199 (yellow dotted line).
Fig. 1 (weekly chart).
Comprehensive analysis:
- Indicator analysis – down;
- Fibonacci levels – up;
- Volume – up;
- Candlestick analysis – up;
- Trend analysis – up;
- Bollinger Bands – down;
- Monthly chart – up.
The conclusion of the comprehensive analysis is an upward movement.
The overall result of calculating the candle of the EUR / USD currency pair according to the weekly chart: the price of the week is likely to have an upward trend with the absence of the first lower shadow of the weekly white candlestick (Monday – up) and the lack of the second upper shadow (Friday – up).