 English
  Русский
 Bahasa Indonesia
 Bahasa Malay
 ไทย
ไทย Español
 Deutsch
 Български
 Français
 Tiếng Việt
 中文
中文 বাংলা
বাংলা हिन्दी
 Čeština
 Українська
 Română

4-hour timeframe
Amplitude of the last 5 days (high-low): 40p - 41p - 28p - 49p - 101p.
Average volatility over the past 5 days: 53p (average).
Immediately with the opening of the European trading session on Monday, the US dollar began to rise in price, winning back Friday losses, which was caused by Jerome Powell's absolutely neutral speech in Jackson Hall. From our point of view, there were no grounds for the fall of the US currency on Friday. The decrease in the US dollar happened due to the demolition of large pending buy orders or, conversely, due to profit taking on short positions around 2-year lows of the euro/dollar pair. Traders are clearly afraid to open strong sales of the euro at current, already low, positions. They cannot be blamed. One of the main tenets of market trading says: "Sell at highs, buy at lows." Of course, this postulate does not explain how to accurately determine whether a pair has reached a low or peak, without taking into account the fundamental background. Nevertheless, the mere fact of finding the pair at 2-year lows makes the bears behave more cautiously and restrained.
The July US durable goods orders report came out much later than the white candle on the chart. The main indicator grew by 2.1% YoY, which is higher than expert forecasts, the second most important indicator - excluding defense and aviation orders - grew by 0.4% YoY with a forecast of -0.1%. Thus, the report turned out to be very positive, which once again casts doubt on the fact that the Fed will definitely reduce the key rate in September. The trade war with China is in full swing and its end is not visible, on the contrary, it is only gaining momentum. Donald Trump rages and devotes almost every tweet to China (naturally in a negative color), as well as Jerome Powell, who does not want to help Trump in a trade war with China, as Trump himself believes. However, US macroeconomic indicators show surprising resistance to conflict with Beijing. Given the fact that trade disagreements began back in 2018, the effects of the introduction of trade duties on both sides of the US economy are reflected only superficially. Thus, why should the Fed go for a second easing of monetary policy, if all is well? This is what Jerome Powell has said. The Federal Reserve will respond to economic indicators and intervene if necessary, and not because Trump believes that the rate should be reduced.
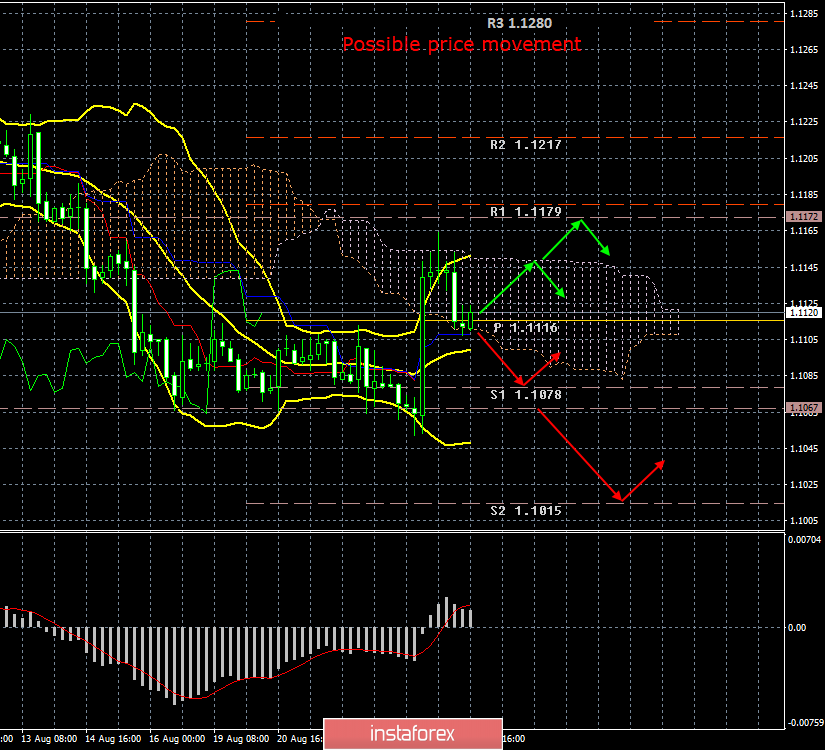
Based on the foregoing, the US dollar may return to growth this week, as the fundamental picture has not changed much, and in technical terms the pair could not overcome the Senkou Span B line, which is the upper border of the Ichimoku cloud and strong resistance. Thus, in the near future, the price may fall below the critical line, which will be the first signal to return to a downward trend.
Trading recommendations:
The EUR/USD pair began to correct against a weak upward trend. The price rebound from the Kijun-sen line will keep the bullish mood in the market and allow the pair to test the Senkou Span B line for the second time. Going below the critical line will indicate a return to the bear market and in this case it is recommended to sell the euro with the first target of 1.1078.
In addition to the technical picture, fundamental data and the time of their release should also be taken into account.
Explanation of the illustration:
Ichimoku indicator:
Tenkan-sen is the red line.
Kijun-sen is the blue line.
Senkou Span A - light brown dotted line.
Senkou Span B - light purple dashed line.
Chikou Span - green line.
Bollinger Bands Indicator:
3 yellow lines.
MACD indicator:
Red line and bar graph with white bars in the indicator window.