 English
  Русский
 Bahasa Indonesia
 Bahasa Malay
 ไทย
ไทย Español
 Deutsch
 Български
 Français
 Tiếng Việt
 中文
中文 বাংলা
বাংলা हिन्दी
 Čeština
 Українська
 Română

EUR/USD
The euro pulled back on Monday, returning to the range of the past week waiting for the symposium in Jackson Hole, closing the day down by 41 points. Technically, the pullback occurred from the Fibonacci level of 110.0% and the indicator balance line on the daily chart. The signal line of the Marlin oscillator fluctuates at the boundary of trends - falling and rising.
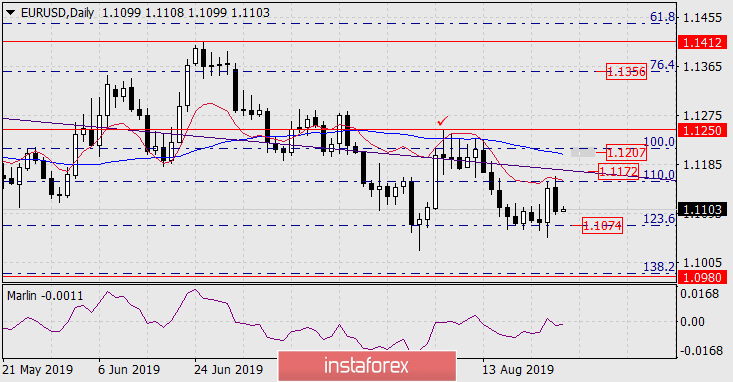
On the four-hour chart, the price consolidated below the MACD indicator line, Marlin is still in the growth zone. In general, the situation remains uncertain and in equilibrium; to continue the decline, it is necessary to consolidate below the Fibonacci level of 123.6% (1.1074), moving upwards have three strong resistances: 1.1172 is the price channel line on daily, 1.1207 as the average value of the MACD line and Fibonacci level 100.0%, 1.1250 - the high of August 6, from any target, a price reversal into a medium-term decline can occur.
