 English
  Русский
 Bahasa Indonesia
 Bahasa Malay
 ไทย
ไทย Español
 Deutsch
 Български
 Français
 Tiếng Việt
 中文
中文 বাংলা
বাংলা हिन्दी
 Čeština
 Українська
 Română

Trend analysis (Fig. 1).
On Wednesday, the downward movement with the target of 1.1065 is the support line (blue bold line). There is a chance of breaking this line down and then continue to the next target of 1.1053, which is the lower fractal.
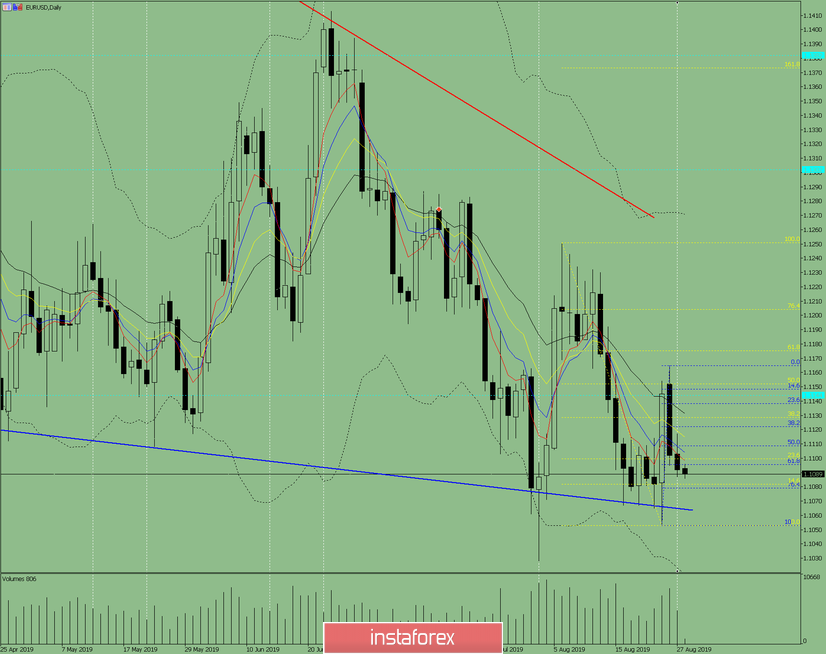
Fig. 1 (daily chart).
Comprehensive analysis:
- indicator analysis - down;
- Fibonacci levels - down;
- volumes - down;
- candlestick analysis - down;
- trend analysis - down;
- Bollinger Lines - down;
- weekly schedule - down.
General conclusion:
On Wednesday, the downward movement with the target of 1.1065 is the support line (blue bold line). There is a chance of breaking this line down and then continue to the next target of 1.1053, which is the lower fractal.
An unlikely scenario is an upward movement with a target of 1.1100 - a pullback level of 23.6% (yellow dashed line).