 English
  Русский
 Bahasa Indonesia
 Bahasa Malay
 ไทย
ไทย Español
 Deutsch
 Български
 Français
 Tiếng Việt
 中文
中文 বাংলা
বাংলা हिन्दी
 Čeština
 Українська
 Română

The price is moving downward in August, testing the historical support level of 1.2107 (yellow bold line) and after that, the price went upward in a pullback. After an uptrend for the past two weeks, the price almost reached a pullback level of 14.6% at 1.2308 (yellow dashed line). After the intervention of the fundamental analysis, the price has been moving downward again last week. As a result, the monthly candle closed with a Doji.
Trend analysis
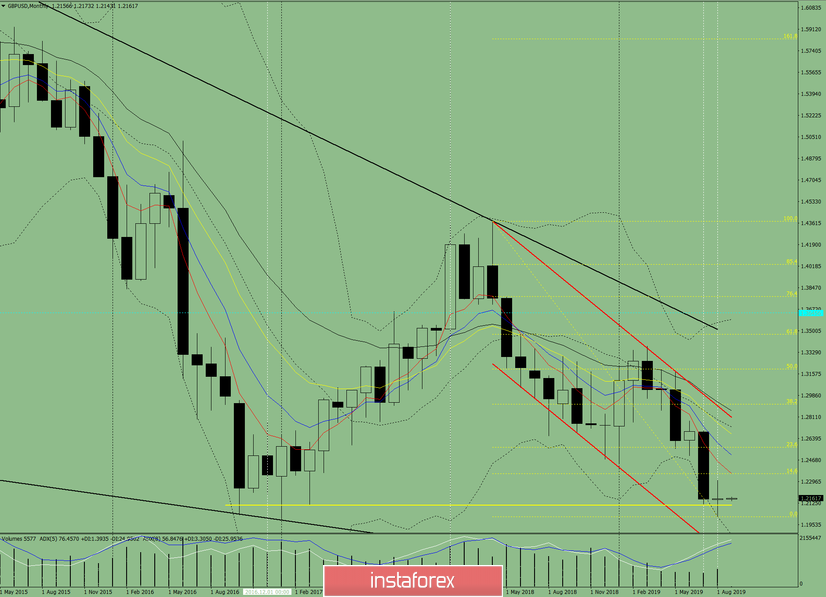
In September, it is possible to move upward with the first target of 1.2356 with a retreating level of 14.6% (yellow dashed line).
Fig. 1 (monthly chart).
Indicator Analysis:
- indicator analysis - up;
- Fibonacci levels - up;
- volumes - up;
- candlestick analysis - up;
- trend analysis - up;
- Bollinger Lines - up;
Conclusion on a comprehensive analysis - the upper hand is possible.
According to the monthly chart, the total result of calculating the GBP/USD candle currency pair: the price will most likely have an upward trend with the absence of the first lower shadow (the first week of the month is white) and the absence of the second upper shadow (last week is white).