 English
  Русский
 Bahasa Indonesia
 Bahasa Malay
 ไทย
ไทย Español
 Deutsch
 Български
 Français
 Tiếng Việt
 中文
中文 বাংলা
বাংলা हिन्दी
 Čeština
 Українська
 Română

On Monday, the pair continued to move down. Moving down, the pair could not break through the strong historical level - 1.1987 (blue dotted line). Today, strong calendar news is expected at 8.30 Universal time (pound) and 14.00 Universal time (dollar). The downward movement may continue.
Trend analysis (Fig. 1).
On Tuesday, the price can continue to move down to the support line - 1.1938 (red bold line) and from there, a pullback upward movement with the target 1.1987 - resistance line (red bold line) may start.
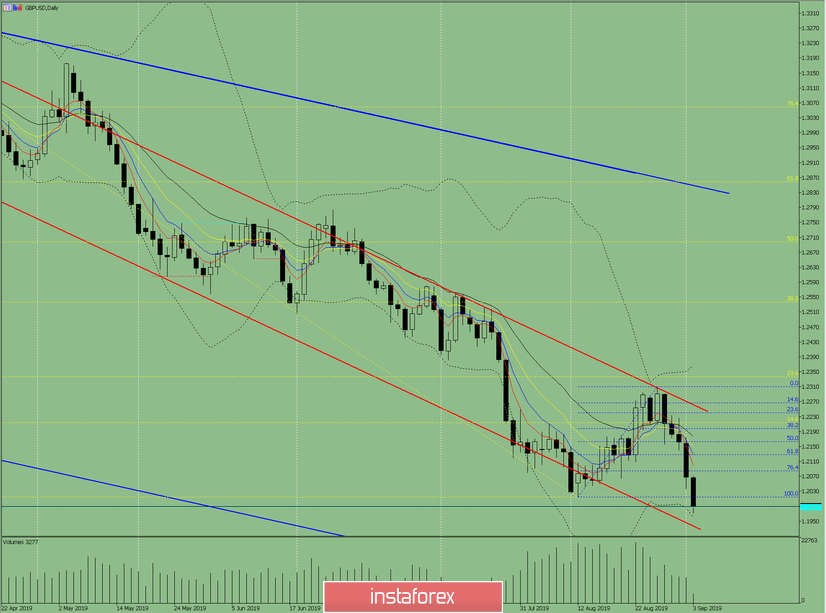
Fig. 1 (daily chart).
Comprehensive analysis:
- indicator analysis - down;
- Fibonacci levels - down;
- volumes - down;
- candlestick analysis - up;
- trend analysis - down;
- Bollinger Lines - up;
- weekly schedule - up.
General conclusion:
On Tuesday, the price can continue to move down to the support line - 1.1938 (red bold line) and from there, a pullback upward movement with the target 1.1987 - resistance line (red bold line) may start.