 English
  Русский
 Bahasa Indonesia
 Bahasa Malay
 ไทย
ไทย Español
 Deutsch
 Български
 Français
 Tiếng Việt
 中文
中文 বাংলা
বাংলা हिन्दी
 Čeština
 Українська
 Română

Trend analysis (Fig. 1).
On Monday, the price, after testing the pullback level of 38.2% - 1.2503 (yellow dashed line), may begin a pullback downward movement with the target 1.2426 - a pullback level of 14.6% (blue dashed line).
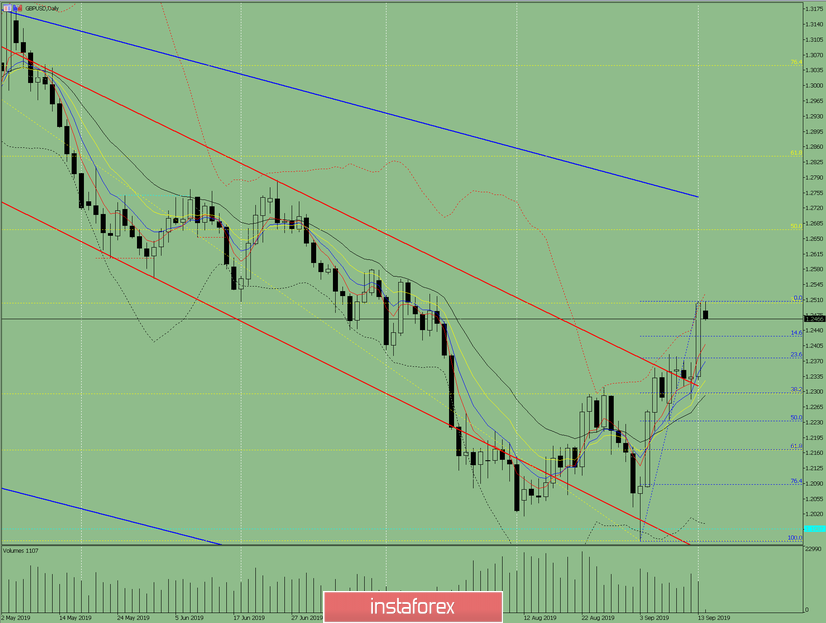
Fig. 1 (daily chart).
Comprehensive analysis:
- indicator analysis - down;
- Fibonacci levels - down;
- volumes - down;
- candlestick analysis - down;
- trend analysis - up;
- Bollinger Lines - up;
- weekly schedule - up.
General conclusion:
On Monday, the price may begin to move down.
An unlikely scenario is an upward movement, with the target of 1.2671 - a pullback level of 50.0% (yellow dashed line).