English
  Русский
 Bahasa Indonesia
 Bahasa Malay
 ไทย
ไทย Español
 Deutsch
 Български
 Français
 Tiếng Việt
 中文
中文 বাংলা
বাংলা हिन्दी
 Čeština
 Українська
 Română

GBP/USD
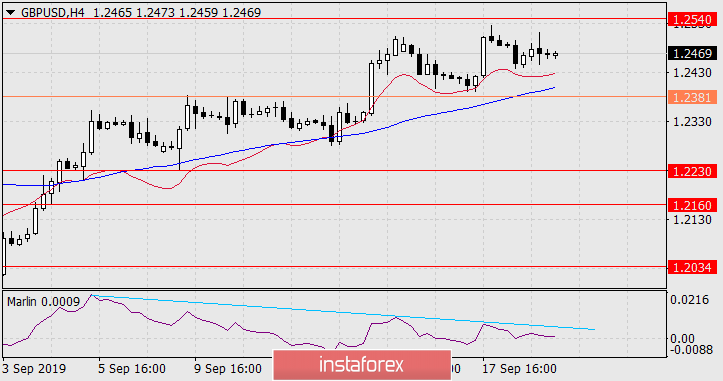
Very slowly, on the fourth day, the pound unfolds after the rapid growth on the 13th. On the daily chart, the Marlin oscillator is moving down, the resistance of the embedded line of the price channel remains unattained. Leaving the price at the signal level 1.2381 will trigger a significant decrease to the target values of 1.2230 - the Fibonacci level of 223.6% and 1.2160 - the Fibonacci level of 238.2% at the point of intersection with the price channel line.

An elongated double divergence on the Marlin oscillator is formed on the four-hour chart, this is a sign of a price reversal. But while the signal level has not been overcome, there remains the likelihood of another price jump up to the 1.2540 range.