English
  Русский
 Bahasa Indonesia
 Bahasa Malay
 ไทย
ไทย Español
 Deutsch
 Български
 Français
 Tiếng Việt
 中文
中文 বাংলা
বাংলা हिन्दी
 Čeština
 Українська
 Română

EUR/USD
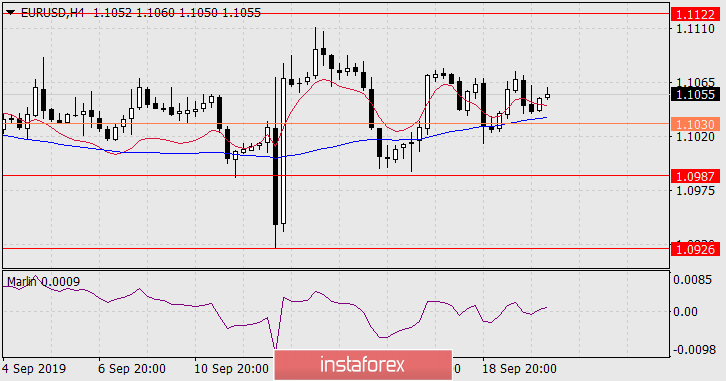
On Thursday, the euro once again marked the upper shadow on the daily chart with a Fibonacci level of 123.6%, which kept the technical indicators in an upward position. On the daily chart, this has resulted in a reversal of the signal line of the Marlin oscillator from the boundary with the territory of the bears on the four-hour chart - the transition of the same oscillator to the growth zone and price retention above the indicator lines of balance and MACD.
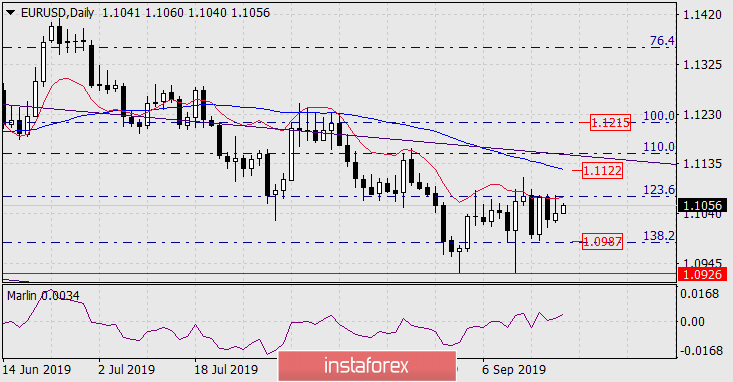
Overcoming yesterday's high (which automatically leads to a move above the Fibonacci level of 123.6%) may trigger further growth to the MACD line at daily 1.1122.
Consolidating the price below the MACD line at H4, below the signal level of 1.1030, opens the short-term target of 1.0987 - the Fibonacci level of 138.2%. Overcoming the latter opens the target of 1.0926.