 English
  Русский
 Bahasa Indonesia
 Bahasa Malay
 ไทย
ไทย Español
 Deutsch
 Български
 Français
 Tiếng Việt
 中文
中文 বাংলা
বাংলা हिन्दी
 Čeština
 Українська
 Română

Trend analysis (Fig. 1).
On Friday, the price after breaking through the pullback level of 38.2% (1.2502 - the red dotted line) may continue to move up to the target of 1.2670 - the pullback level of 50% (red dashed line). The next level may occur pullbacks to bottom: 1.2560 (the upper fractal), 1.2649 (the upper boundary of the Bollinger bands).
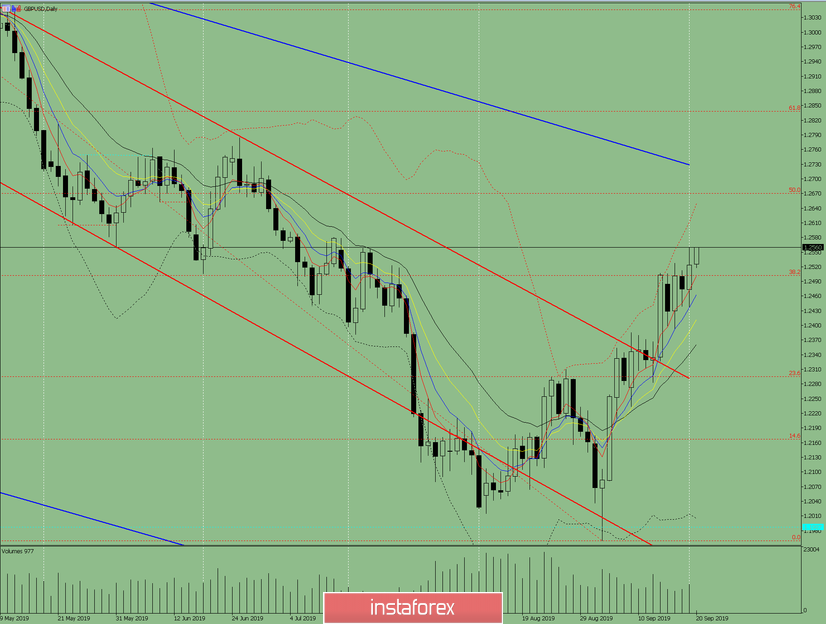
Fig. 1 (daily chart).
Comprehensive analysis:
- indicator analysis - up;
- Fibonacci levels - up;
- volumes - up;
- candlestick analysis - up;
- trend analysis - up;
- Bollinger Lines - up;
- weekly schedule - up.
General conclusion:
On Friday, the price will continue to move up.
An unlikely scenario is a downward movement, with the first target of 1.2438 - a lower fractal.