 English
  Русский
 Bahasa Indonesia
 Bahasa Malay
 ไทย
ไทย Español
 Deutsch
 Български
 Français
 Tiếng Việt
 中文
中文 বাংলা
বাংলা हिन्दी
 Čeština
 Українська
 Română

Trend analysis (Fig. 1).
On Wednesday, after a repeated unsuccessful attempt to break through the pullback level of 23.6% - 1.0935 (blue dashed line), the price may possibly make a pullback move down with the target 1.0921 - the target level is 168.2% (red dashed line). From this level, there is a good opportunity to work up with the target of 1.0968 - a pullback level of 38.2% (blue dashed line).
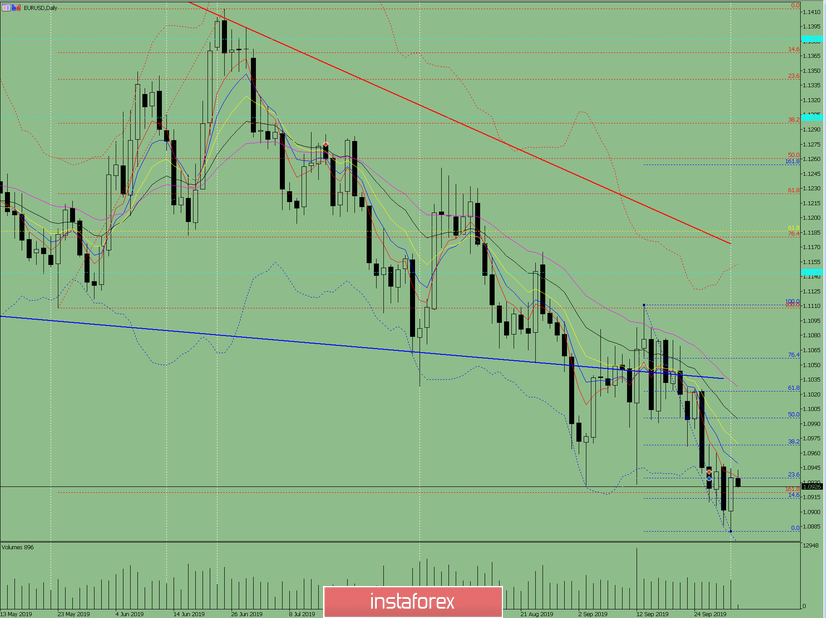
Fig. 1 (daily chart).
Comprehensive analysis:
- indicator analysis - up;
- Fibonacci levels - up;
- volumes - up;
- candlestick analysis - up;
- trend analysis - down;
- Bollinger Lines - up;
- weekly schedule - up.
General conclusion:
On Wednesday, an upward movement is possible.
The upper target of 1.0968 is a pullback level of 38.2% (blue dashed line).
The intermediate target is 1.1049 - the upper fractal.
An unlikely scenario is lower work with the target of 1.0880 - lower fractal.