 English
  Русский
 Bahasa Indonesia
 Bahasa Malay
 ไทย
ไทย Español
 Deutsch
 Български
 Français
 Tiếng Việt
 中文
中文 বাংলা
বাংলা हिन्दी
 Čeština
 Українська
 Română

On Thursday, the pair moved on a side channel having tested the pullback level of 50.0% - 1,0996 (blue dashed line) and 21 average EMA - 1.0971 (black thin line). Breaking up this cloud, consisting of two levels, will be difficult for the bulls, although the bulls will try to do it again. On Friday, strong calendar news is expected at 13.30 and 19.00 London time (dollar). Also today, a downward pullback is possible.
Trend analysis (Fig. 1).
On Friday, candlestick analysis also gives a strong bottom (last three consecutive white candles, decreasing over the body). Before the news, a downward pullback may begin, with an intermediate target of 1.0972 - a pullback level of 23.6% (yellow dashed line) and the final target 1.0954 - a pullback level of 38.2% (yellow dashed line). Much will depend on the news that comes out at 13.30 London time.
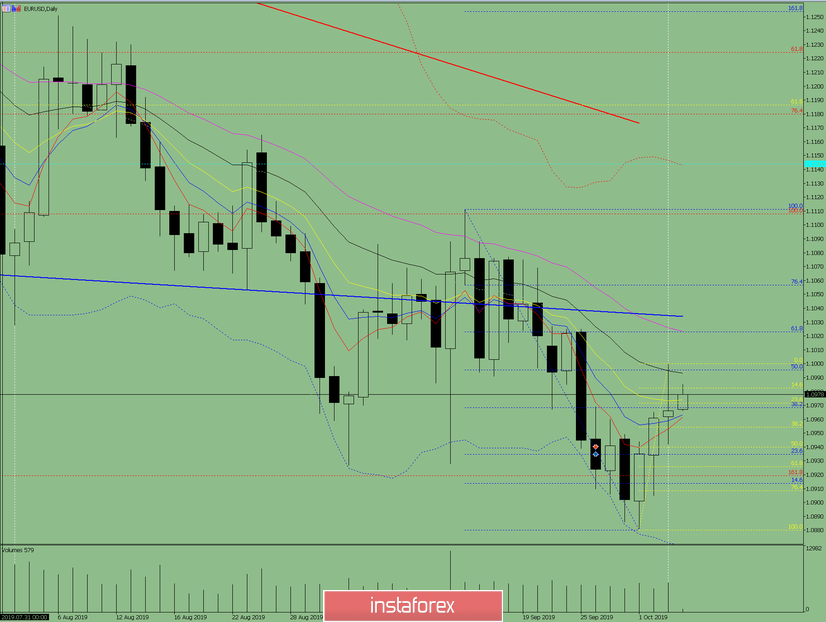
Fig. 1 (daily chart).
Comprehensive analysis:
- indicator analysis - up;
- Fibonacci levels - down;
- volumes - up;
- candlestick analysis - down;
- trend analysis - up;
- Bollinger Lines - down;
- weekly schedule - up.
General conclusion:
On Friday, before the news, a pullback downward is possible.
The lower target is 1.0954 - a pullback level of 38.2% (yellow dashed line).
The intermediate target is 1.0972 - a pullback level of 23.6% (yellow dashed line).
An unlikely scenario is the upper work with the target 1.1035 - resistance line (blue bold line).