 English
  Русский
 Bahasa Indonesia
 Bahasa Malay
 ไทย
ไทย Español
 Deutsch
 Български
 Français
 Tiếng Việt
 中文
中文 বাংলা
বাংলা हिन्दी
 Čeština
 Українська
 Română

Trend analysis (Fig. 1).
On Monday, the bulls will try to break through the upper fractal 1.1000 (yellow dashed line) once again and, if successful, the next target 1.1033 is the resistance line (blue bold line).
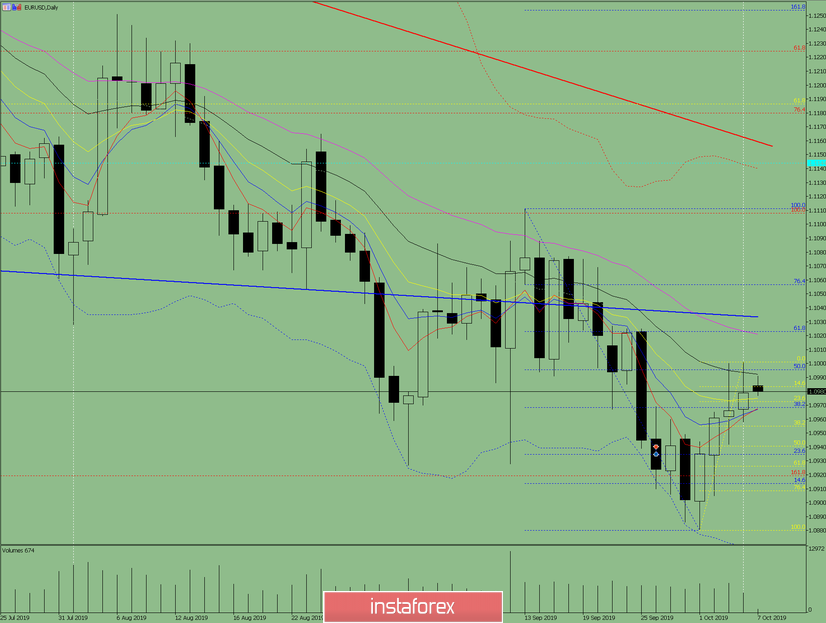
Fig. 1 (daily chart).
Comprehensive analysis:
- indicator analysis - up;
- Fibonacci levels - up;
- volumes - up;
- candlestick analysis - down;
- trend analysis - up;
- Bollinger Lines - down;
- weekly schedule - up.
General conclusion:
On Monday, the continuation of the upward movement is possible.
The upper intermediate target 1.1000 is the upper fractal (yellow dashed line).
The final target is 1.1033 - the resistance line (blue bold line).
An unlikely scenario is the lower work with the target of 1.0955 - a pullback level of 38.2% (yellow dashed line).