 English
  Русский
 Bahasa Indonesia
 Bahasa Malay
 ไทย
ไทย Español
 Deutsch
 Български
 Français
 Tiếng Việt
 中文
中文 বাংলা
বাংলা हिन्दी
 Čeština
 Українська
 Română

To open long positions on EURUSD, you need:
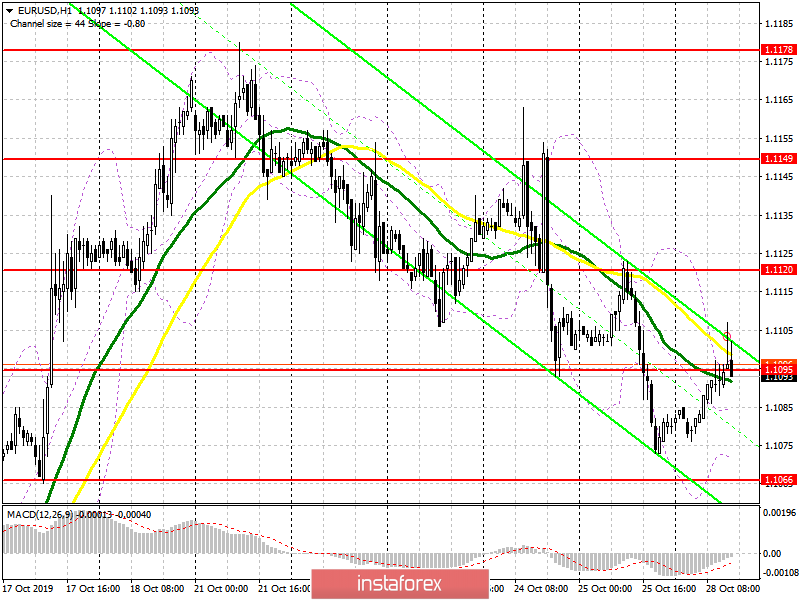
A good report on the growth of wholesale prices in Germany supported the euro in the first half of the day, but as I expected, it was not possible to break above the resistance of 1.1095 and gain a foothold there. News that the EU approved the postponement of the UK's exit also did not provide much support to the bulls. At the moment, the task of buyers is to return to the level of 1.1095, and only under this condition can we expect a larger upward correction in the area of the highs of 1.1120 and 1.1149, where I recommend taking the profits. If the pressure on the euro returns, and this may happen during the speech of the President of the European Central Bank Mario Draghi, it is best to consider new long positions after a false breakdown in the support area of 1.1006 or buy for a rebound from the minimum of 1.1026.
To open short positions on EURUSD, you need:
Sellers coped with the task for the first half of the day and did not let the pair above the resistance of 1.1095, forming a false breakdown there, which is a signal to sell the euro. I spoke about this in more detail in my morning forecast. At the moment, while trading below the resistance of 1.1095, pressure on the pair will remain and the ECB President Mario Draghi may cause the upgrade to a new weekly low of 1.1066, and to its breakthrough, which will hit the bulls with stop orders and push the euro even lower, to support 1.1026, where I recommend taking the profits. If Draghi's performance is ignored, it is best to return to short positions from the resistance of 1.1120 or to rebound from a new high of 1.1149.
Indicator signals:
Moving Averages
Trading is conducted around 30 and 50 moving averages, which indicates market uncertainty.
Bollinger Bands
The lower border of the indicator around 1.1075 acts as a support.
Description of indicators
- MA (moving average) 50 days – yellow
- MA (moving average) 30 days – green
- MACD: fast EMA 12, slow EMA 26, SMA 9
- Bollinger Bands 20