 English
  Русский
 Bahasa Indonesia
 Bahasa Malay
 ไทย
ไทย Español
 Deutsch
 Български
 Français
 Tiếng Việt
 中文
中文 বাংলা
বাংলা हिन्दी
 Čeština
 Українська
 Română

Trend analysis (Fig. 1).
On Tuesday, the price may begin to move down with the first target at 1.2764 - a pullback level of 23.6% (blue dashed line). In case of breaking through this level, the continuation of the downward movement to the 21st average EMA is 1.2701 (black thin line).
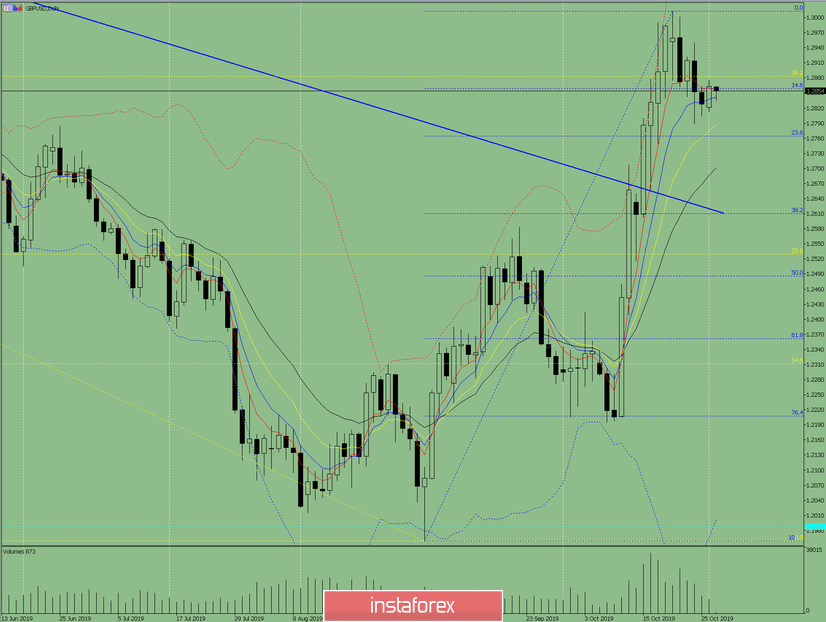
Fig. 1 (daily chart).
Comprehensive analysis:
- Indicator analysis - down;
- Fibonacci levels - down;
- Volumes - down;
- Candlestick analysis - down;
- Trend analysis - up;
- Bollinger Lines - down;
- Weekly schedule - down.
General conclusion:
On Tuesday, the price may roll back down.
The first lower target 1.2764 is a retracement level of 23.6% (blue dashed line).
The second lower target is 1.2701 - 21 average EMA (black thin line).
An unlikely scenario is an upward trend with the target at 1.2950 (upper fractal).