 English
  Русский
 Bahasa Indonesia
 Bahasa Malay
 ไทย
ไทย Español
 Deutsch
 Български
 Français
 Tiếng Việt
 中文
中文 বাংলা
বাংলা हिन्दी
 Čeština
 Українська
 Română

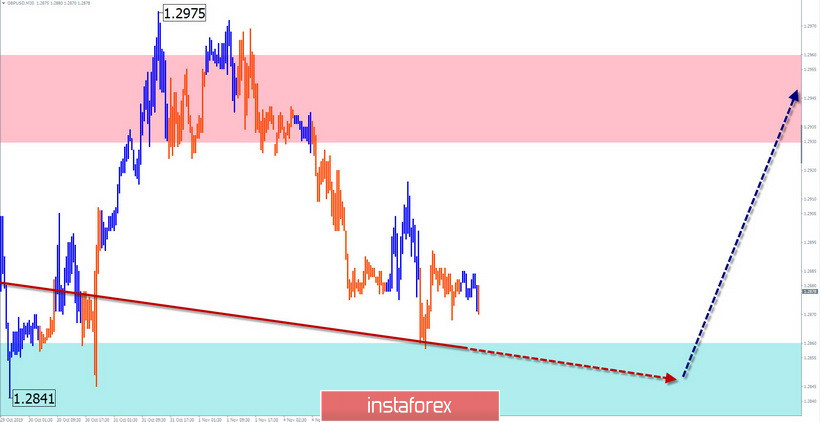
GBP/USD
Analysis:
The upward wave since the beginning of August sets the dominant rate of the British pound. The wave has a high wave level and will eventually move to a medium-term scale. In recent weeks, the price forms a counter area, which can form correction of the entire previous rise. The wave has the form of a flat pennant.
Forecast:
The pound correction has entered the final phase. The formation of a reversal pattern and the beginning of a price rise is expected over the next day. Before that, short-term pressure on support is not excluded. It is possible to synchronize the reversal with the release time of important news.
Potential reversal zones
Resistance:
- 1.2930/1.2960
Support:
- 1.2860/1.28300
Recommendations:
Selling the pound today can be very risky. It is recommended that the main attention be paid to the search for signals to buy an instrument.
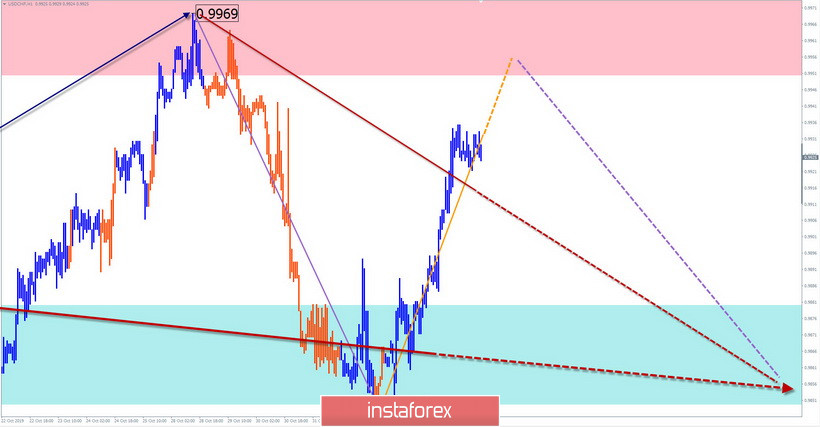
USD/CHF
Analysis:
A stretched plane has been developing on the franc chart since the end of June. The final part (C) of the wave structure is formed. Within its framework, a correction has developed over the past month, which has not yet been completed.
Forecast:
In the first half of the day, the completion of the upward section is expected. By the end of the day, the probability of a rate change and a price decline in the area of the support zone increases.
Potential reversal zones
Resistance:
- 0.9950/0.9980
Support:
- 0.9880/0.9850
Recommendations:
Purchases today are possible when trading within the session, a reduced lot. In the resistance area, it is recommended to monitor the reversal signals and search for the selling points of the pair.
Explanations: In the simplified wave analysis (UVA), the waves consist of 3 parts (A-B-C). The last unfinished wave is analyzed. The solid background of the arrows shows the formed structure, dotted – the expected movement.
Attention: The wave algorithm does not take into account the length of time the tool moves!