 English
  Русский
 Bahasa Indonesia
 Bahasa Malay
 ไทย
ไทย Español
 Deutsch
 Български
 Français
 Tiếng Việt
 中文
中文 বাংলা
বাংলা हिन्दी
 Čeština
 Українська
 Română

Trend analysis.
This week, the price will move down to 1.0993 – a retracement level of 61.8% (red dotted line). A breakdown of this level down will be unlikely and the market will most likely try to move upward from the level of 1.0993, in rollback, with the first target of 1.1070 – resistance line (blue bold line).
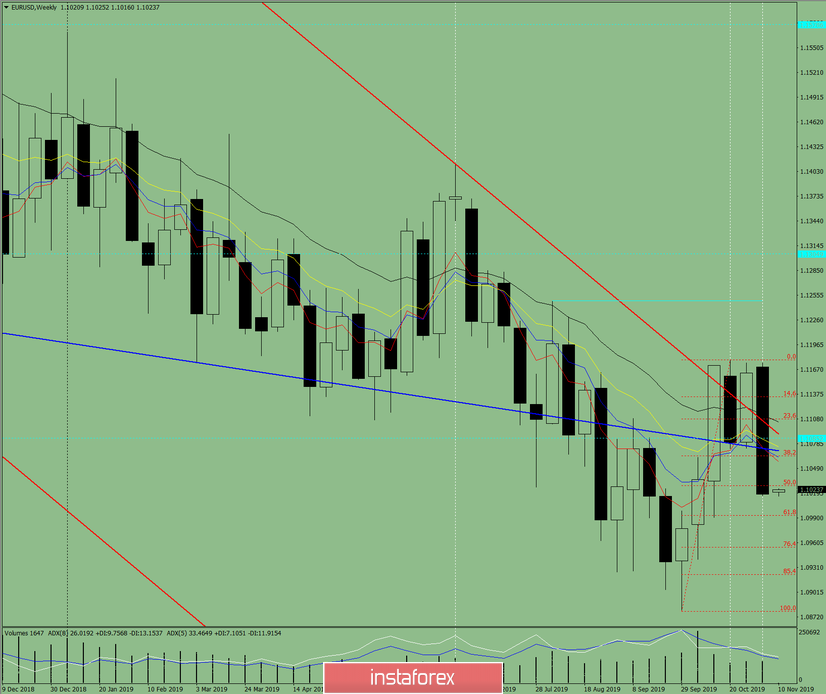
Fig. 1 (weekly chart).
Complex analysis:
- Indicator analysis – up;
- Fibonacci levels – down;
- Volumes – up;
- Candlestick analysis – down;
- Trend analysis – down;
- Bollinger bands – down;
- Monthly chart – down.
The conclusion of the complex analysis – a downward movement.
The overall result of calculating the candle of the EUR/USD currency pair according to the weekly chart: the price of the week is likely to have a downward trend, with the absence of the first upper shadow of the weekly black candlestick (Monday – down) and the absence of the second lower shadow (Friday – down).
The first lower target of 1.0993 – a retracement level of 61.8% (red dotted line). From this level, it is possible to roll back upward with the target of 1.1070 – a rollback level of 14.6% (red dotted line).
An unlikely scenario – from the level of 1.1016, upward movement with the target of .1249 – resistance line (blue bold line).