 English
  Русский
 Bahasa Indonesia
 Bahasa Malay
 ไทย
ไทย Español
 Deutsch
 Български
 Français
 Tiếng Việt
 中文
中文 বাংলা
বাংলা हिन्दी
 Čeština
 Українська
 Română

Trend analysis (Fig. 1).
On Wednesday, the price may move up to the upper fractal - 1.2898. From this level, it is possible to continue moving up to the retreating level of 61.8% - 1.2919 (red dashed line).
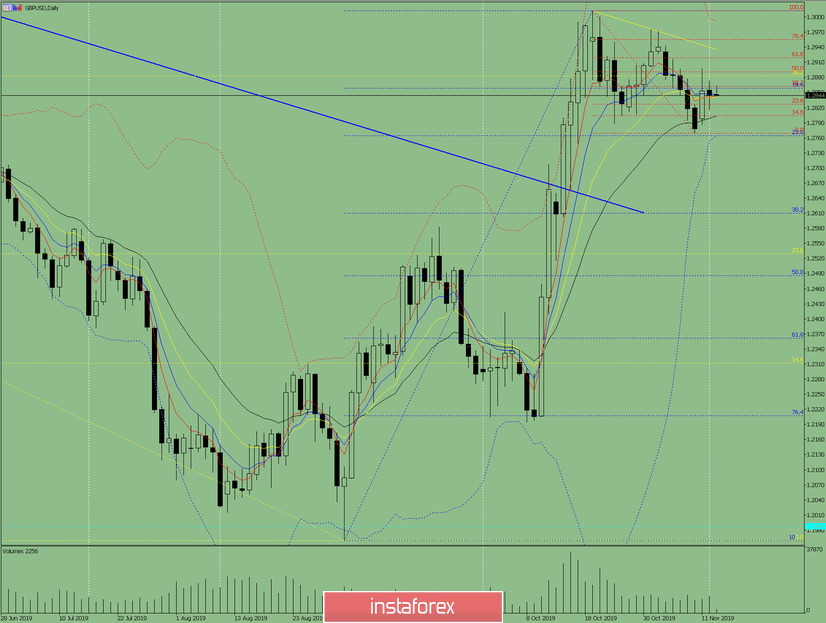
Fig. 1 (daily chart).
Comprehensive analysis:
- Indicator analysis - up;
- Fibonacci levels - up;
- Volumes - up;
- Candlestick analysis - up;
- Trend analysis - up;
- Bollinger Lines - up;
- Weekly schedule - up.
General conclusion:
On Wednesday, the price may continue to move up.
The first upper target is the upper fractal 1.2898. From this level, it is possible to continue moving up to the retreating level of 61.8% - 1.2919 (red dashed line).
The lower scenario is a downward movement to the lower fractal - 1.2769 (red dashed line).
The work plan for today is until 16.00 UTC +, 15 minutes on the chart.
When the histogram is above zero (MASD 21/34/55), the entrance is upward along the 3/3/5 stochastic when crossing its fast (white) slow (blue) from bottom to top.
Fig. 2 (schedule 15 minutes).