 English
  Русский
 Bahasa Indonesia
 Bahasa Malay
 ไทย
ไทย Español
 Deutsch
 Български
 Français
 Tiếng Việt
 中文
中文 বাংলা
বাংলা हिन्दी
 Čeština
 Українська
 Română

The pair on Thursday could not gain a foothold above the resistance line 1.1081 (red bold line) which went down also, the foundation played an important role in this. Moving down, the price reached a pullback level of 38.2% - 1.1057 (red dashed line). On Friday, strong calendar news is expected at 07.00 and 08.30 Universal time (Euro). Meanwhile, another attempt to break the resistance line up is possible.
Trend analysis (Fig. 1).
On Friday, the market will move up with the target 1.1078 - resistance line (red bold line). On the news, the price can break this level up in order to achieve a pullback level of 50.0% - 1.1085 (blue dashed line) and, if successful, can continue to move up, with a target of 1.1108 - a pullback level of 61.8 % (blue dashed line).
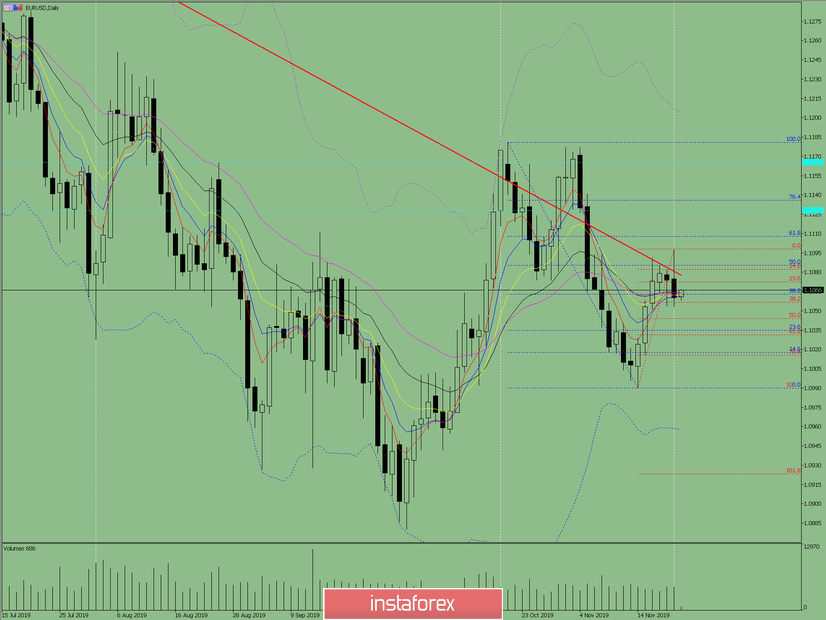
Fig. 1 (daily chart).
Comprehensive analysis:
- Indicator analysis - up;
- Fibonacci levels - up;
- Volumes - up;
- Candlestick analysis - neutral;
- Trend analysis - neutral;
- Bollinger Lines - up;
- Weekly schedule - up.
General conclusion:
On Friday, upward movement is possible.
The first upper target is the retreating level of 50.0% - 1.1085 (blue dashed line) and, if successful, the continuation of the upward movement, with the target 1.1108 - the retreating level of 61.8% (blue dashed line).
An unlikely scenario is a downward movement towards the target 1.1044 - a retracement level of 50% (red dashed line).