 English
  Русский
 Bahasa Indonesia
 Bahasa Malay
 ไทย
ไทย Español
 Deutsch
 Български
 Français
 Tiếng Việt
 中文
中文 বাংলা
বাংলা हिन्दी
 Čeština
 Українська
 Română

Trend analysis (Fig. 1).
On Thursday, the price will move up with the first target of 1.2976 which is the resistance line in red bold line. Breaking through this level the first time is unlikely, and from this level, you can work down by placing a pending order "sell limit" at 1.2973 with a short stop of 1.3003 that is equivalent to 30 points.
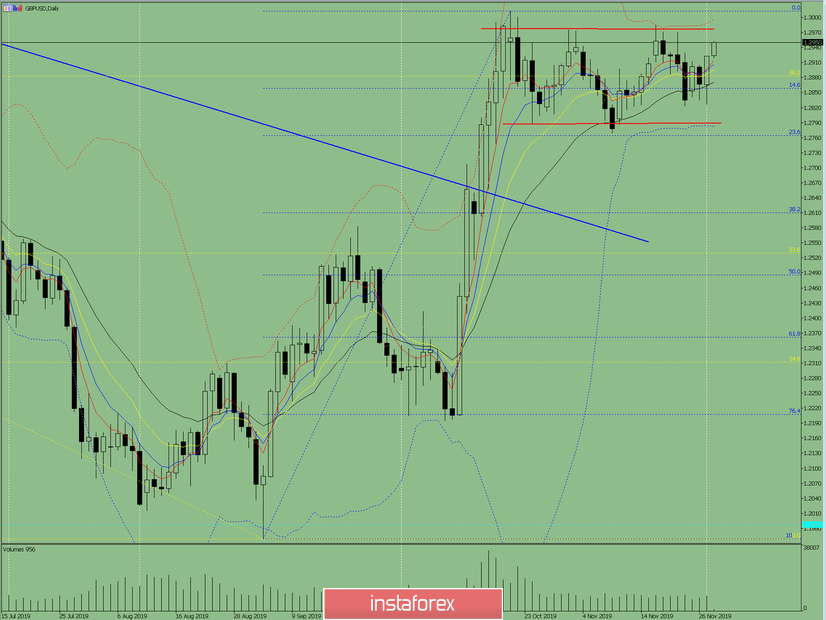
Fig. 1 (daily chart).
Comprehensive analysis:
- Indicator analysis - up;
- Fibonacci levels - up;
- Volumes - up;
- Candlestick analysis - up;
- Trend analysis - up;
- Bollinger Lines - up;
- Weekly schedule - up.
General conclusion:
On Thursday, the price of technology may continue to move up.
The price will move up, with the target of 1.2976, the resistance line in red bold line. Breaking through this level the first time is unlikely, and from this level, you can work down by placing a pending order "sell limit" at 1.2973 with a short stop of 1.3003 that is equivalent to 30 points.
An unlikely scenario is from the level of 1.2976, work up to the upper fractal of 1.3013 in blue dashed line.