 English
  Русский
 Bahasa Indonesia
 Bahasa Malay
 ไทย
ไทย Español
 Deutsch
 Български
 Français
 Tiếng Việt
 中文
中文 বাংলা
বাংলা हिन्दी
 Čeština
 Українська
 Română

Trend analysis (Fig. 1).
On Wednesday, the price may continue to move down with the first target support level of 1.2937 presented in a red bold line. If successful, the next lower target which is 1.2920 is a retracement level of 38.2% presented in a red dashed line.
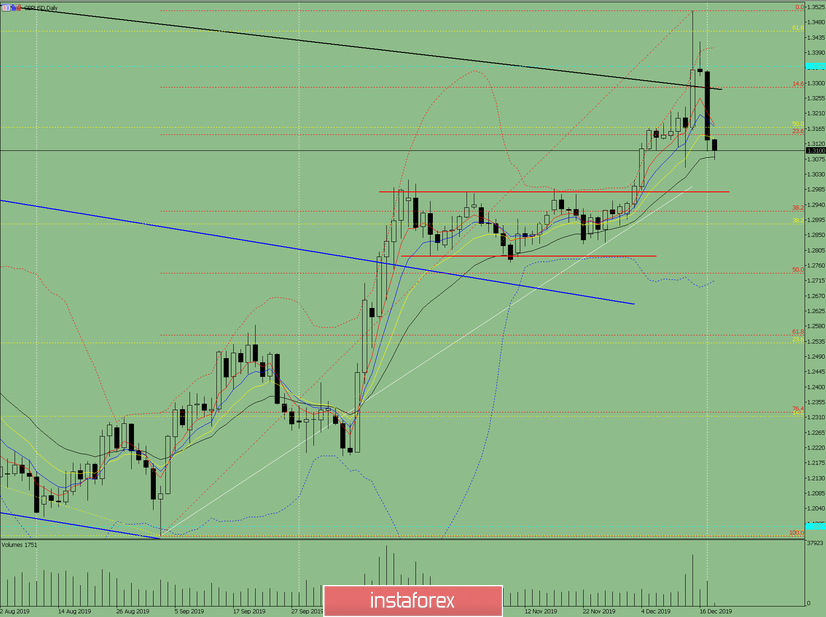
Fig. 1 (daily chart).
Comprehensive analysis:
- Indicator analysis - down;
- Fibonacci levels - down;
- Volumes - down;
- Candlestick analysis - down;
- Trend analysis - down;
- Bollinger Lines - down;
- Weekly schedule - down.
General conclusion:
On Wednesday, the price will continue to move down.
Another scenario is unlikely but possible. That is, from the level 1.3081 - 21, the average EMA is working up as presented in a black thin line, and the target 1.3284 is the resistance line presented in a black bold line.