 English
  Русский
 Bahasa Indonesia
 Bahasa Malay
 ไทย
ไทย Español
 Deutsch
 Български
 Français
 Tiếng Việt
 中文
中文 বাংলা
বাংলা हिन्दी
 Čeština
 Українська
 Română

Trend analysis (Fig. 1).
On Thursday, the price may begin to move up with the first target 1.1146 which is a pullback level of 50.0% presented in a blue dashed line. If this level is reached, there is a continuation of work upwards with the target of 1.1176 which is the upper fractal.
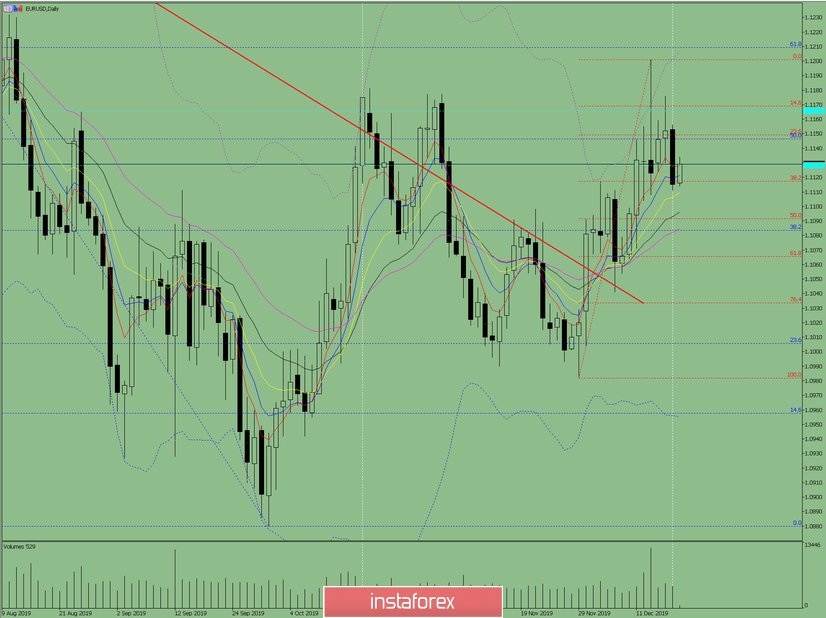
Fig. 1 (daily chart).
Comprehensive analysis:
- Indicator analysis - up;
- Fibonacci levels - up;
- Volumes - up;
- Candlestick analysis - neutral;
- Trend analysis - up;
- Bollinger Lines - up;
- Weekly schedule - up.
General conclusion:
On Thursday, an upward trend is possible.
The unlikely scenario is from the historical resistance level of 1.1128 presented in a blue dashed line, the price goes down to the lower target 1.1092 which is a pullback level of 50.0% presented in a red dashed line.