 English
  Русский
 Bahasa Indonesia
 Bahasa Malay
 ไทย
ไทย Español
 Deutsch
 Български
 Français
 Tiếng Việt
 中文
中文 বাংলা
বাংলা हिन्दी
 Čeština
 Українська
 Română

Trend analysis (Fig. 1).
On Monday, the price can make a pullback move up with the first target of 1.3105 which is a pullback level of 23.6% presented in a blue dashed line. If this line is reached, there is a continuation of work upward with the next target of 1.3184 which is a retracement level of 38.2% presented in a blue dashed line.
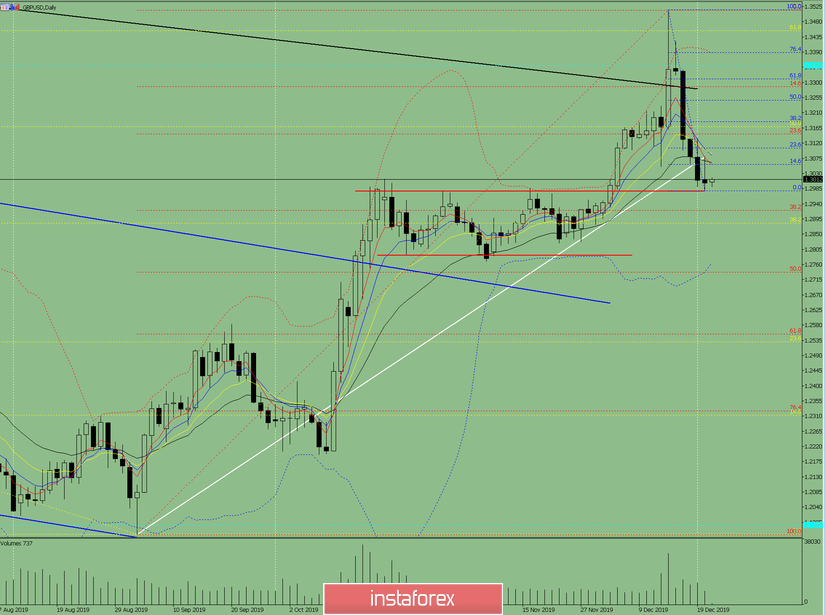
Fig. 1 (daily chart).
Comprehensive analysis:
- Indicator analysis - up;
- Fibonacci levels - up;
- Volumes - up;
- Candlestick analysis - up;
- Trend analysis - up;
- Bollinger Lines - down;
- Weekly schedule - up.
General conclusion:
On Monday, the price may roll back up.
It is unlikely, but another scenario is possible, where, from the support line of 1.2979 presented in a red bold line, work down, with the target of 1.2920 which is a pullback level of 38.2% presented in a red dashed line.