Short-term trend remains bearish in Ichimoku cloud terms. Price is not only below the Kumo (cloud), but also below the tenkan-sen (red line indicator) and the kijun-sen (yellow line indicator). Price is trying to break above the two indicators which provide short-term resistance at 1.1610-1.1620.
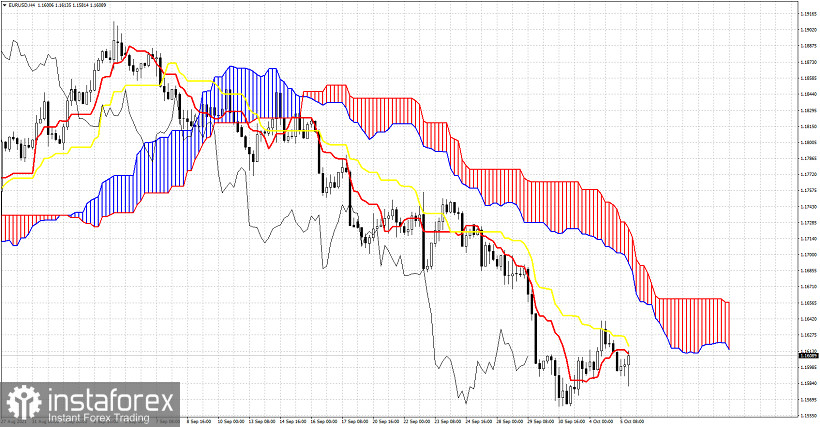
If bulls manage to break above 1.1620 in the 4 hour chart, we should then expect price to move closer to the Ichimoku cloud towards 1.1665. Breaking above the Kumo (cloud) would be the first important bullish sign and trend reversal signal. Until then we consider this upward move as a counter trend bounce.
*The market analysis posted here is meant to increase your awareness, but not to give instructions to make a trade
 English
  Русский
 Bahasa Indonesia
 Bahasa Malay
 ไทย
ไทย Español
 Deutsch
 Български
 Français
 Tiếng Việt
 中文
中文 বাংলা
বাংলা हिन्दी
 Čeština
 Українська
 Română
