 English
  Русский
 Bahasa Indonesia
 Bahasa Malay
 ไทย
ไทย Español
 Deutsch
 Български
 Français
 Tiếng Việt
 中文
中文 বাংলা
বাংলা हिन्दी
 Čeština
 Українська
 Română

Hello, dear colleagues!
At the end of last week, the US dollar traded differently against its main competitors. In particular, the main currency pair EUR/USD ended trading on December 16-20 with losses, which is not surprising.
If you remember, the euro/dollar review of a week ago, to a greater extent, assumed a downward scenario. That's exactly what happened.
Weekly
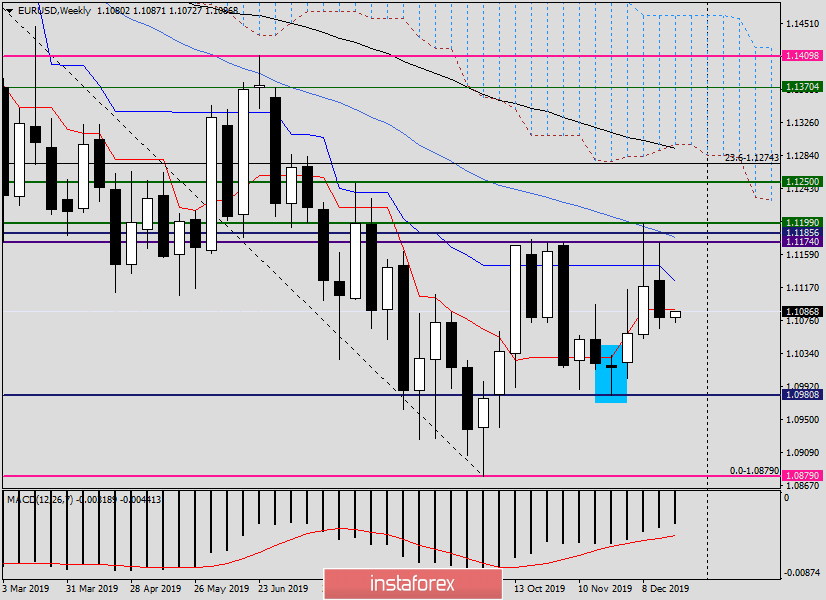
The main reason for the decline of the pair was the previous white candle with a huge upper shadow. Usually, such large upper shadows, which are larger than the body itself, show the inability of the market to continue the upward movement and signal its completion. This is followed by a reversal of the correction or change of trend. The current moment was no exception.
What's next? Perhaps this is the main question that interests everyone.
Given that the last five-day trading ended under the Kijun and Tenkan lines of the Ichimoku indicator, it is quite possible to expect the continuation of the downward dynamics. Let me remind you that the closing prices of the week and the day say a lot, especially about the weekly closing price. As I shared my opinion earlier, the weekly timeframe, in my opinion, is the strongest in terms of signals, to which, of course, the closing price of the last candle also applies.
It is characteristic that the week closed not only below the important mark of 1.1100 but also under the already well-known technical level of 1.1080. Let 1 point lower, but lower! And this is a factor to be reckoned with.
So, on the "week", the resistance is represented by the Tenkan (1.1090) and Kijun (1.1125) lines of the Ichimoku indicator. A 50-simple moving average, which runs at 1.1180, is ready to provide resistance above.
Immediate support is the last week's lows at 1.1066, if updated, the road will open to the levels of 1.1053, 1.1003 and, possibly, to the key support level of 1.0981. These are the immediate goals and benchmarks on the weekly chart. We are going further. We go further.
Daily
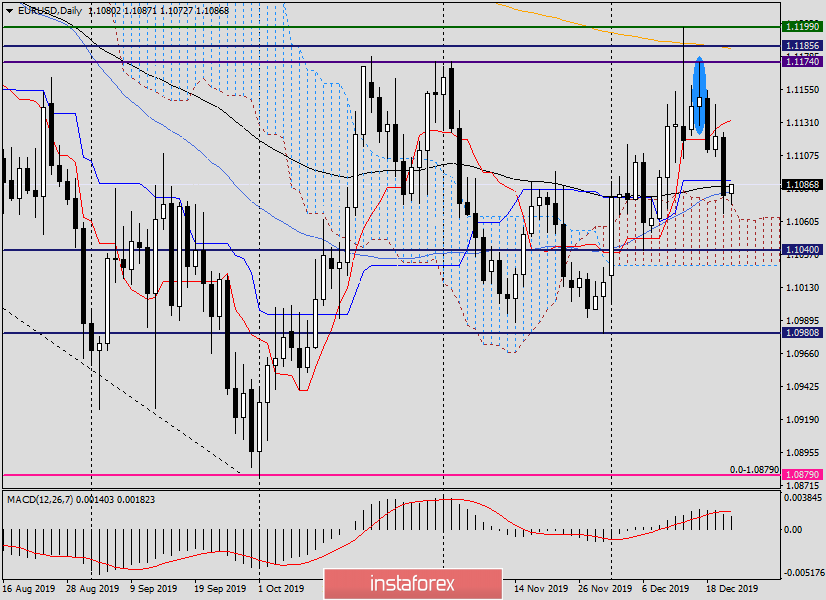
In this timeframe, the pair fell into a strong and extremely important support zone of 1.1090-1.1074. As you can see, the bears are trying to lower the quote within the Ichimoku cloud, but the bulls have other plans.
At the time of writing, the pair has found support in the designated area and shows intentions to recover to the previous decline. Now, 89 EMA (black) and Kijun line (1.1090) can provide the nearest resistance to growth attempts. However, the current resistance is provided by the 50-simple moving average, which is located at 1.1082. In my personal opinion, only the passage of 50 MA, 89 EMA, and Kijun, with the closure of at least one candle (or better, three in a row) above 1.1090, will indicate the ability of the quote to further strengthen. If the rate falls within the Ichimoku cloud and it is fixed, we can expect a decline to its lower border, which passes near 1.1030. If we sum up the consideration of the daily chart, the situation is still uncertain. It is necessary to wait and see how the next few days will close relative to the designated landmarks.
H4
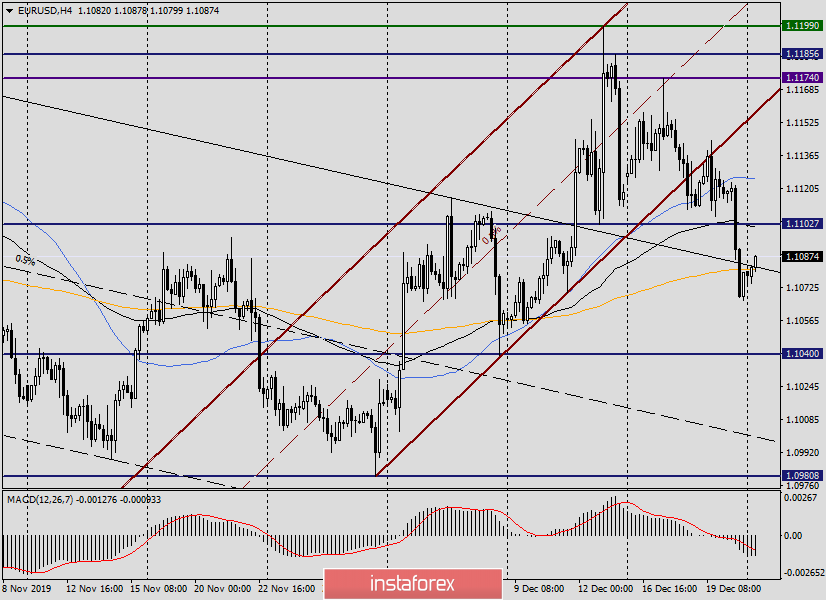
The price is trying to return above the strong 233 exponential moving average, which is right at the moment of completion of this review. If the current 4-hour candle closes above 233 EMAs, we can expect a continued rollback to the area of 1.1100-1.1125, where there are 89 EMAs, a strong technical level of 1.1100 and 50 MA.
The most relevant trading idea at the moment is sales from the selected area.
Those wishing to buy the euro, I recommend looking at the strong technical zone of 1.1045-1.1000 and, when bullish candlestick analysis patterns appear there, consider opening long positions.
That's all for now, tomorrow we will continue to consider the main currency pair, and, perhaps, taking into account today's trading, the picture will take a clearer shape. At the moment, in the personal opinion of the author, the main trading idea is selling EUR/USD.
Good luck!