 English
  Русский
 Bahasa Indonesia
 Bahasa Malay
 ไทย
ไทย Español
 Deutsch
 Български
 Français
 Tiếng Việt
 中文
中文 বাংলা
বাংলা हिन्दी
 Čeština
 Українська
 Română

To open long positions on GBPUSD, you need:
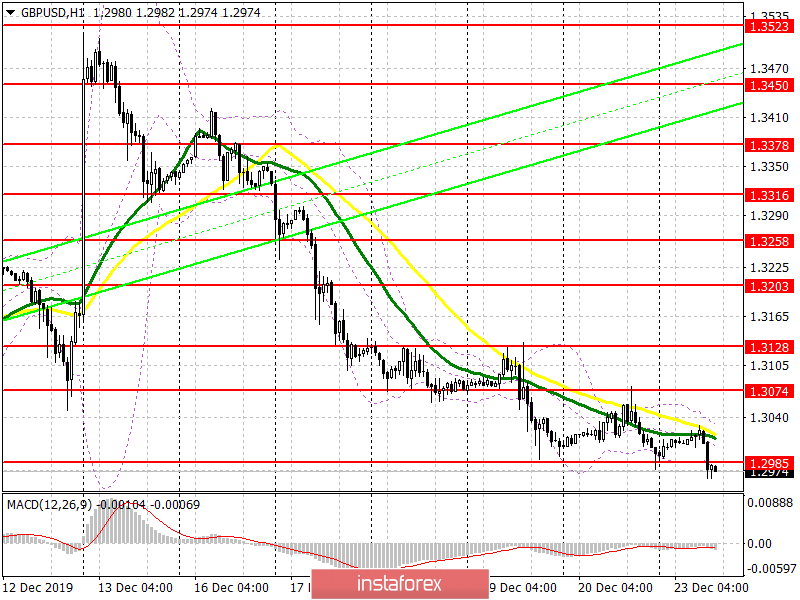
Bulls cannot stop the pressure on the pound, which was formed the day after the victory of the Conservative Party of Great Britain. This time, the bears slowly but surely settled below the support of 1.2985, which I paid attention to in my morning forecast, which may lead to another sell-off of the pound. Buyers urgently, before the end of the day, need to return to 1.2985, and only then can we talk about attempts to correct in the resistance area of 1.3074 and then return to 1.3128, where I recommend fixing the profits. In case of further fall of GBP/USD, it is best to return to long positions after the support test of 1.2933 or a rebound from the December low of 1.2882.
To open short positions on GBPUSD, you need:
Sellers continue to push the pair down and this time took the support of 1.2985, which has now transformed into resistance. If the bulls soon will not be able to return to this level, we can expect the continuation of the sale of GBP/USD in the area of lows of 1.2933 and 1.2882, to which I drew my attention in the morning forecast and where I recommend taking the profits. If in the second half of the day, the demand for the pound will return, and this can happen only with weak fundamental statistics on the American economy, then short positions can be returned after updating the maximum of 1.3074 or sell immediately on a rebound from 1.3128.
Indicator signals:
Moving Averages
Trading is below the 30 and 50 daily averages, indicating that the bearish nature of the market remains.
Bollinger Bands
If the pound rises in the second half of the day, the upper limit of the channel 1.3050 will act as a resistance, from which you can sell immediately for a rebound.
Description of indicators
- Moving average (moving average determines the current trend by smoothing out volatility and noise). Period 50. The graph is marked in yellow.
- Moving average (moving average determines the current trend by smoothing out volatility and noise). Period 30. The graph is marked in green.
- MACD indicator (Moving Average Convergence / Divergence - Moving Average Convergence / Divergence). Fast EMA period 12. Slow EMA period 26. SMA period 9.
- Bollinger Bands (Bollinger Bands). Period 20.