 English
  Русский
 Bahasa Indonesia
 Bahasa Malay
 ไทย
ไทย Español
 Deutsch
 Български
 Français
 Tiếng Việt
 中文
中文 বাংলা
বাংলা हिन्दी
 Čeština
 Українська
 Română

Trend analysis (Fig. 1).
On Friday, the price may continue to move down with the target at 1.3095, a pullback level of 50.0% presented in a red dashed line. If this line is reached, the continuation of work down with the target of 1.3050 is a retracement level of 61.8% presented in a red dashed line.
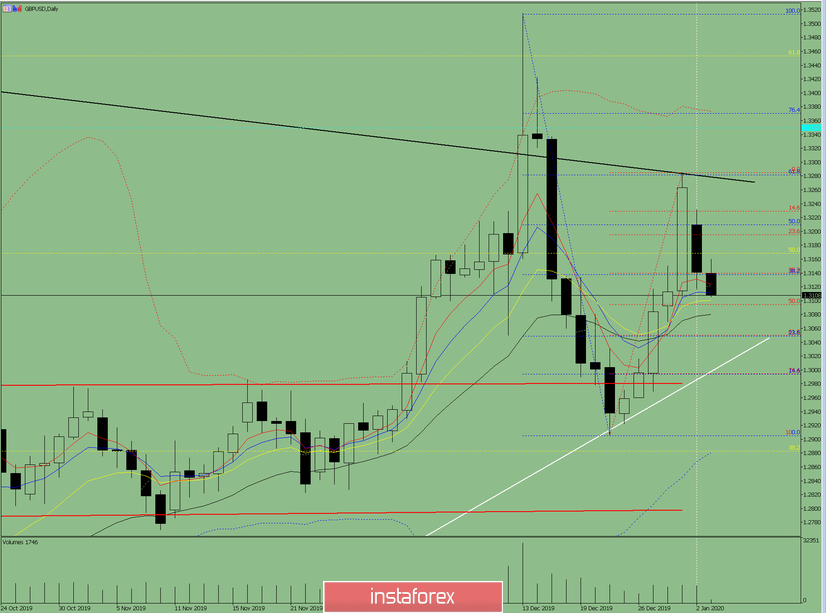
Fig. 1 (daily chart).
Comprehensive analysis:
- Indicator analysis - down;
- Fibonacci levels - down;
- Volumes - down;
- Candlestick analysis - down;
- Trend analysis - up;
- Bollinger Lines - up;
- Weekly schedule - up.
General conclusion:
On Friday, the price may continue to move down.
The scenario where from a pullback level of 50.0% which is equivalent to 1.3095 presented in a red dashed line, to work up with a target of 1.3169, a pullback level of 50.0% presented in a yellow dashed line is unlikely.