 English
  Русский
 Bahasa Indonesia
 Bahasa Malay
 ไทย
ไทย Español
 Deutsch
 Български
 Français
 Tiếng Việt
 中文
中文 বাংলা
বাংলা हिन्दी
 Čeština
 Українська
 Română

Trend analysis.
This week, the price will move up to the first target of 1.1145, with a pullback level of 50.0% (blue dotted line). If we are able to break through the top of this level, the next top target will be a pullback level of 61.8% - 1.1208 (blue dotted line).
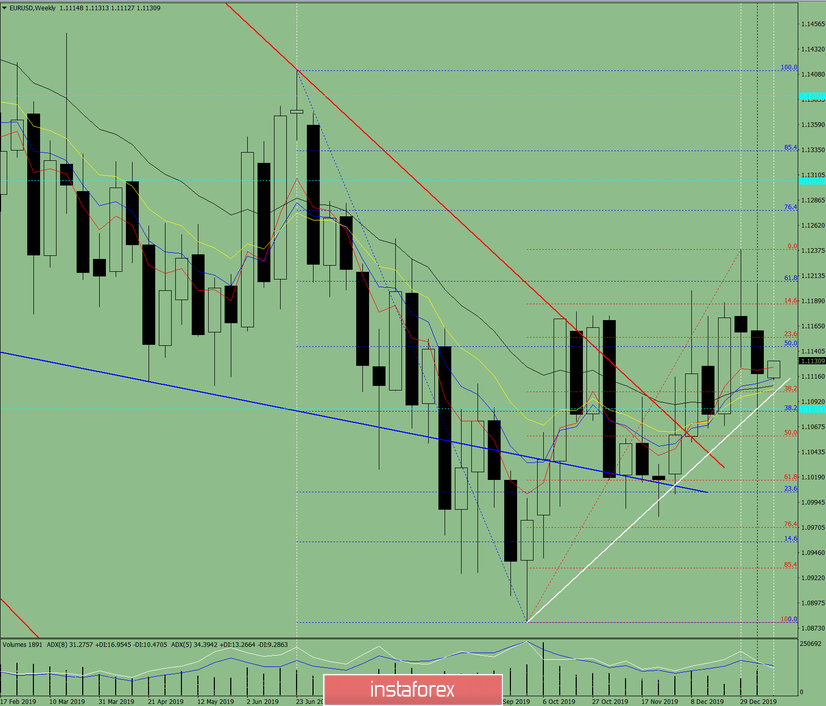
Fig. 1 (weekly chart).
Indicator analysis:
- Indicator analysis: up;
- Fibonacci levels: up;
- Volumes: up;
- Candle analysis: up;
- Trend analysis: up;
- Bollinger lines: up;
- Monthly schedule: up.
In conclusion, the complex analysis signals an upward movement.
Calculating the total candles of EUR/USD in the weekly chart, the price of the week is likely to have an upward trend. There is an absence of the first lower shadow at the weekly white candle (Monday – up), as well as the lack of the second upper shadow (Friday – up).
An unlikely lower scenario is: from the level of 1.1119 (the previous week's close), a move down from the first lower target of the support line 1.1094 (the white bold line). If successful, the next lower target of 1.1058 is a pullback level of 50.0% (red dotted line).