 English
  Русский
 Bahasa Indonesia
 Bahasa Malay
 ไทย
ไทย Español
 Deutsch
 Български
 Français
 Tiếng Việt
 中文
中文 বাংলা
বাংলা हिन्दी
 Čeština
 Українська
 Română

Last week, the GBP / USD pair moved up to 1.3166 (blue dotted line) and tested the pullback level of 50.0%. Afterwards, the price went down, almost returning to the opening point of the weekly candle. Most likely, the price this week will once again try to move up in order to break through the resistance line of 1.3236.
Trend analysis.
This week, the price, having strayed from the support line 1.3027 (white fat line), will move up to the resistance line of 1.3236 (black fat line). In the case of a break through, the upper fractal is the continuation of the work upwards, in the goal of 1.3283.
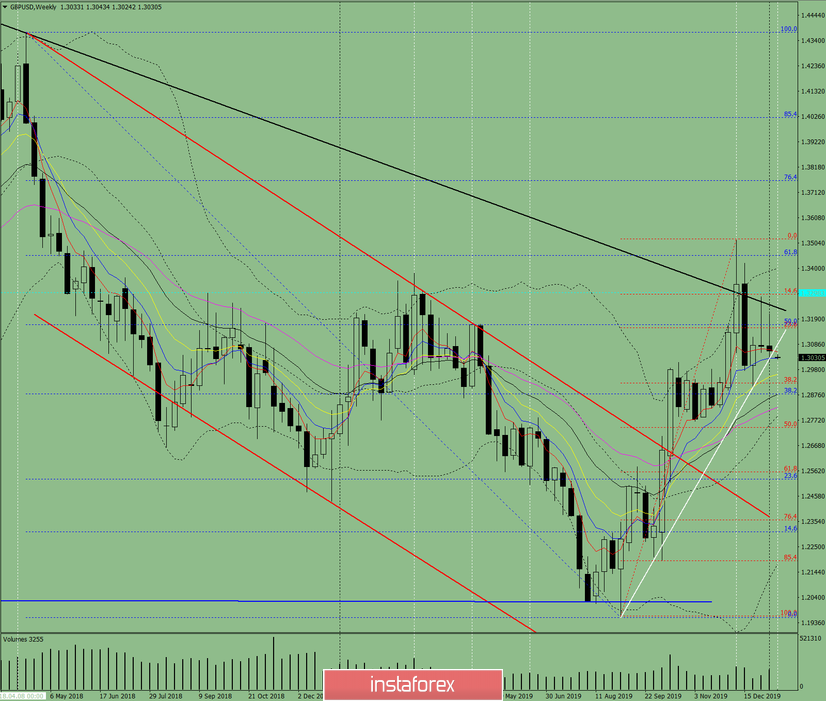
Fig. 1 (weekly chart).
Indicator analysis:
- Indicator analysis: down;
- Fibonacci levels: down;
- Volumes: down;
- Candle analysis: neutral;
- Trend analysis: neutral;
- Bollinger lines: up;
- Monthly schedule: up.
In conclusion, the complex analysis suggests an upward movement.
Calculating the total candles of GBP / USD in the weekly chart: The price of the week is likely to have an upward trend, with the absence of the first lower shadow at the weekly white candle (Monday - up), and a second upper shadow (Friday - down).
It is also unlikely, but a possible scenario, that from the support line 1.3083 (white bold line), there will be a work down in the lower fractal to the target area of 1.2904.