 English
  Русский
 Bahasa Indonesia
 Bahasa Malay
 ไทย
ไทย Español
 Deutsch
 Български
 Français
 Tiếng Việt
 中文
中文 বাংলা
বাংলা हिन्दी
 Čeština
 Українська
 Română

Trend analysis:
This week, the price will move up with the first target 1.1115 - a pullback level of 50.0% (blue dashed line). Upon reaching the continuation of the upper work with the upper goal, the pullback level is 61.8% - 1.1144 (blue dashed line).
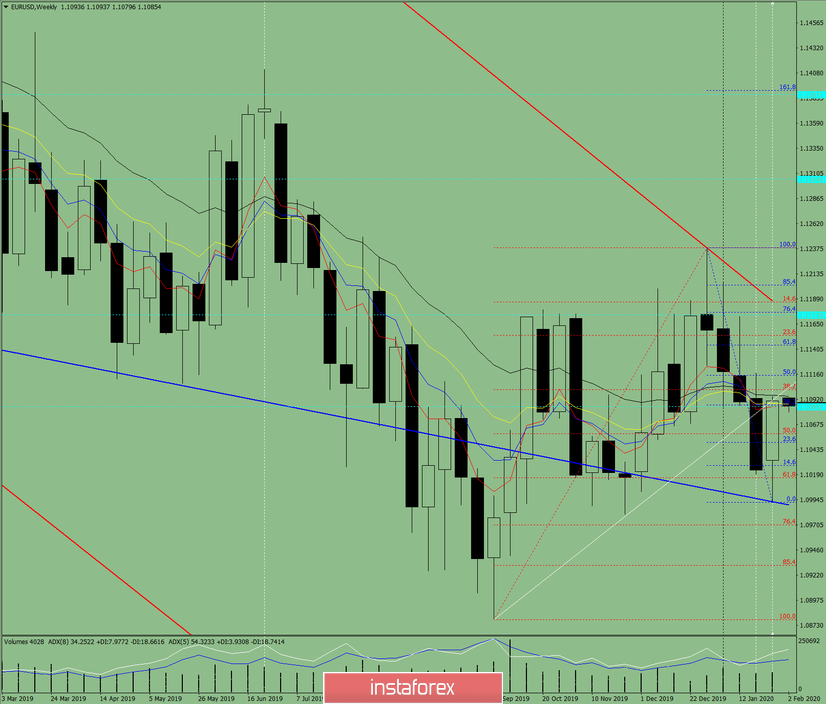
Fig. 1 (weekly schedule).
Comprehensive analysis:
- indicator analysis - up;
- Fibonacci levels - up;
- volumes - down;
- candlestick analysis - up;
- trend analysis - up;
- Bollinger lines - down;
- monthly chart - up.
The conclusion of a comprehensive analysis is an upward movement.
The overall result of calculating the candle of the EUR / USD currency pair according to the weekly chart: the price of the week is likely to have an upward trend, with the absence of the first lower shadow of the weekly white candlestick (Monday - up) and the absence of the second upper shadow (Friday - up).
An unlikely lower scenario: a downward movement with the lower target 1.0992 - lower fractal (blue dashed line) from a pullback level of 38.2% - 1.1086 (blue dashed line).