 English
  Русский
 Bahasa Indonesia
 Bahasa Malay
 ไทย
ไทย Español
 Deutsch
 Български
 Français
 Tiếng Việt
 中文
中文 বাংলা
বাংলা हिन्दी
 Čeština
 Українська
 Română

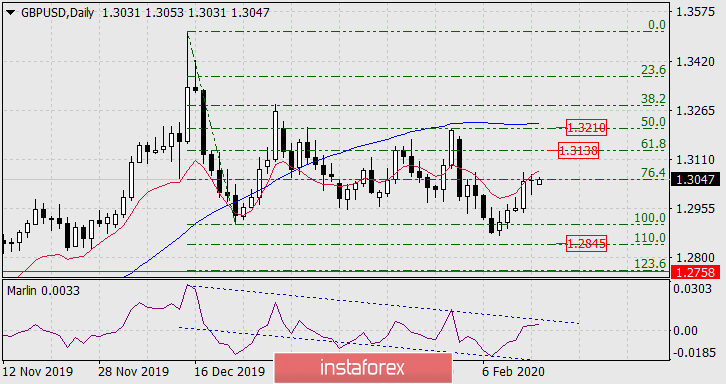
GBP/USD
The British pound closed at the opening level on Friday. There was a struggle at the Fibonacci level of 76.4% on the daily chart. It took place under the indicator line of balance, which implies the predominance of sellers. The signal line of the Marlin oscillator is turning down, not reaching the upper boundary of its own channel. In the event of a price reversal, we expect a quote at 1.2845 - at the Fibonacci level of 110.0%.
On a four-hour chart, the price stays above the indicator lines of balance and MACD, Marlin is falling, but remains in the growing trend zone. Accordingly, a signal that the pound can decrease further will be a price fall below the MACD line (below 1.2945) and the introduction of the Marlin indicator signal line into the zone of negative values. Both of these conditions can occur simultaneously. We are waiting for this signal.

If the price consolidates above the Friday high (respectively, and above the Fibonacci level of 76.4%), growth is likely to continue to 1.3140 (61.8%) and even to 1.3210 (50.0%), to the MACD line. But this is an alternative scenario.