 English
  Русский
 Bahasa Indonesia
 Bahasa Malay
 ไทย
ไทย Español
 Deutsch
 Български
 Français
 Tiếng Việt
 中文
中文 বাংলা
বাংলা हिन्दी
 Čeština
 Українська
 Română

Trend analysis (Fig. 1).
The market may continue to move down today with the target at 1.0783, the lower fractal (red dashed line). Breaking down the lower fractal is unlikely but work up is possible from the level of 1.0783.
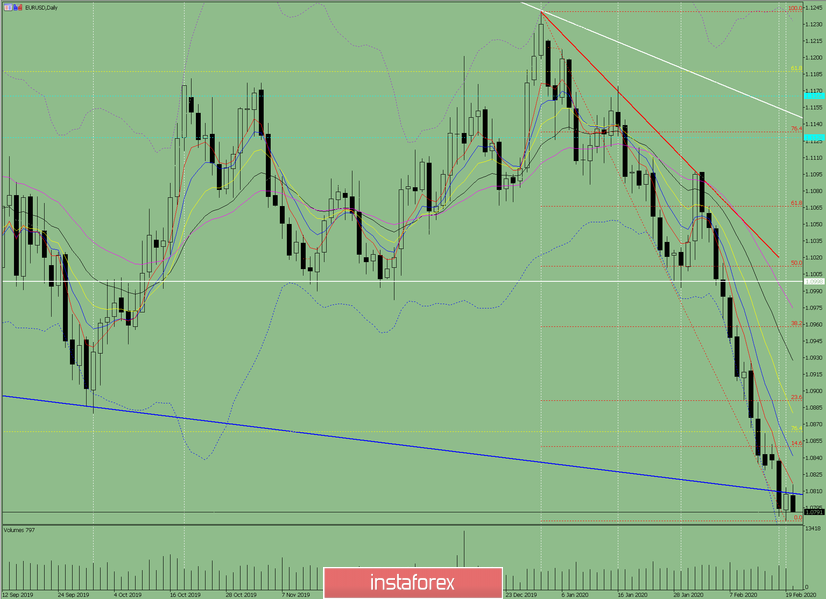
Fig. 1 (daily chart).
Comprehensive analysis:
- Indicator analysis - down;
- Fibonacci levels - down;
- Volumes - up;
- Candlestick analysis - up;
- Trend analysis - up;
- Bollinger Lines - up;
- Weekly schedule - up.
General conclusion:
A continued downward movement is expected today with the target of 1.0783, the lower fractal (red dashed line).
An unlikely but possible scenario is from the lower fractal 1.0783 (red dashed line), a continued work down with the goal of 1.0664, the retracement level of 85.4% (yellow dashed line).