 English
  Русский
 Bahasa Indonesia
 Bahasa Malay
 ไทย
ไทย Español
 Deutsch
 Български
 Français
 Tiếng Việt
 中文
中文 বাংলা
বাংলা हिन्दी
 Čeština
 Українська
 Română

The pair continued its upward movement on Tuesday, testing a pullback level of 23.6% equivalent to 1.0888 (red dotted line). Today, strong calendar news for the euro is expected at 13:30 UTC, and for the dollar at 15:00 and 15:30 UTC. Also, the price may roll back down.
Trend analysis (Fig. 1).
The market may begin to move back down today with the target of 1.0849, the pullback level of 38.2% (blue dashed line). Upon reaching the level of 1.0849, work up.
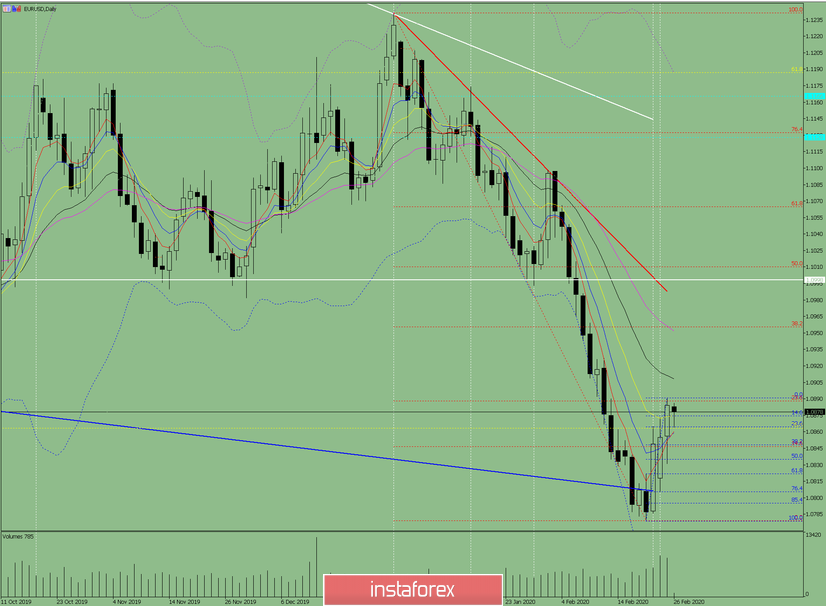
Fig. 1 (daily chart).
Comprehensive analysis:
- Indicator analysis - down;
- Fibonacci levels - down;
- Volumes - up;
- Candlestick analysis - down;
- Trend analysis - up;
- Bollinger lines - down;
- Weekly schedule - up.
General conclusion:
A downward movement is expected today with the target of 1.0849, the retracement level of 38.2% (blue dashed line). From the level of 1.0849, the upward movement is likely to continue.
An unlikely but possible scenario is from a pullback level of 23.6% equivalent to 1.0865 (blue dashed line), work up with the target of 1.0891, the upper fractal (blue dashed line). Upon reaching this level, the next upper target is 1.0908, the 21 average EMA (black thin line).