 English
  Русский
 Bahasa Indonesia
 Bahasa Malay
 ไทย
ไทย Español
 Deutsch
 Български
 Français
 Tiếng Việt
 中文
中文 বাংলা
বাংলা हिन्दी
 Čeština
 Українська
 Română

Trend analysis
In March, the price is likely to rise to the support level of 1.1075 (the red bold line). If the price breaks through this upper line, the next possible target for the currency pair will be 1.1197 which is the pullback level of 23.6% (the red dash line). The pair is likely to test the target of 1.0901, the pullback level of 76.4% (the blue dash line), if the price does not break through the support line.
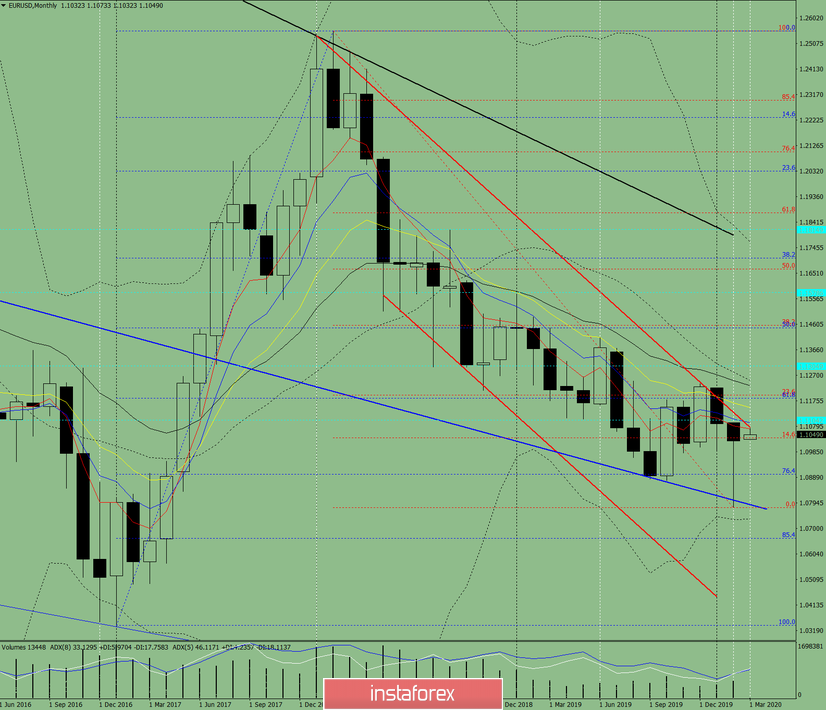
Fig.1. Monthly chart
Indicator analysis:
- indicator analysis – up
- Fibonacci level – up
- volumes– up
- candlestick analysis – neutral
- trend analysis – down
- Bollinger Bands – down
Comprehensive analysis conclusion - the upward trend is expected
The general total of the EUR/USD pair candlestick calculation based on the monthly chart: the uptrend with the absence of the first lower shadow (the first week of the month is white) of the monthly white candlestick and the second upper shadow (the last week is white) is expected.
The uptrend scenario: the price is likely to rise from the resistance line of 1.1075 (the red bold line) to the upper target of 1.1196, the pullback level of 23.6% (the red dash line). The pair is expected to reach 1.1456, the pullback level of 38.2% (the red dash line), if the price breaks through this level.
The downtrend scenario: the pair is likely to rebound from the level of 1.0901, the pullback level of 76.4% (the blue dash line), from the resistance line of 1.1075 (the red bold line).