 English
  Русский
 Bahasa Indonesia
 Bahasa Malay
 ไทย
ไทย Español
 Deutsch
 Български
 Français
 Tiếng Việt
 中文
中文 বাংলা
বাংলা हिन्दी
 Čeština
 Українська
 Română

Trend analysis
In March, the continued downtrend is expected. The pair is likely to test the target of 1.2551, the pullback level of 61.8% (red dashlane). If the price breaks through this level, the next possible downward target for the pair will be the pullback level of 1.2352, or 76.4% (red dashlane).
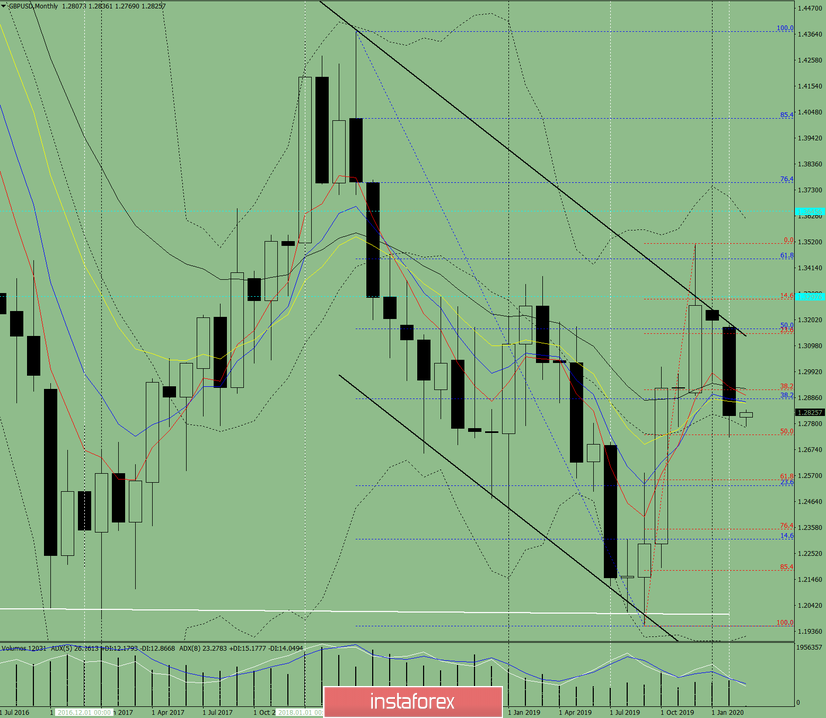
Fig.1. Monthly Chart
Indicator analysis:
- indicator analysis – down
- Fibonacci level – down
- volumes– down
- candlestick analysis – down
- trend analysis – down
- Bollinger Bands – down
Comprehensive analysis conclusion - the downward trend is expected
The general total of the GBP/USD candlestick calculation based on the monthly chart: the downward trend with the absence of the first upper shadow (the first week of the month is black) of the monthly black candlestick and the second lower shadow (the last week is black) is expected
The price is likely to fall to 1.2551 which is a pullback level of 61.8% (the red dash line). If the price drops below this level, the next possible lower target will be 1.2352, the pullback level of 76.4% (the red dash line).
The low-probability scenario: the price is likely to rise from the level of 1.2813 (the closing of the February candlestick) to the target of 1.3131 which is the level of resistance (balck bold line).