 English
  Русский
 Bahasa Indonesia
 Bahasa Malay
 ไทย
ไทย Español
 Deutsch
 Български
 Français
 Tiếng Việt
 中文
中文 বাংলা
বাংলা हिन्दी
 Čeština
 Українська
 Română

Trend analysis (Fig. 1).
Today, from the support line 1.1122 (white bold line) the price can continue to move up with the target at the upper fractal 1.1215 (blue dashed line).
Continuation of work up upon reaching this level.
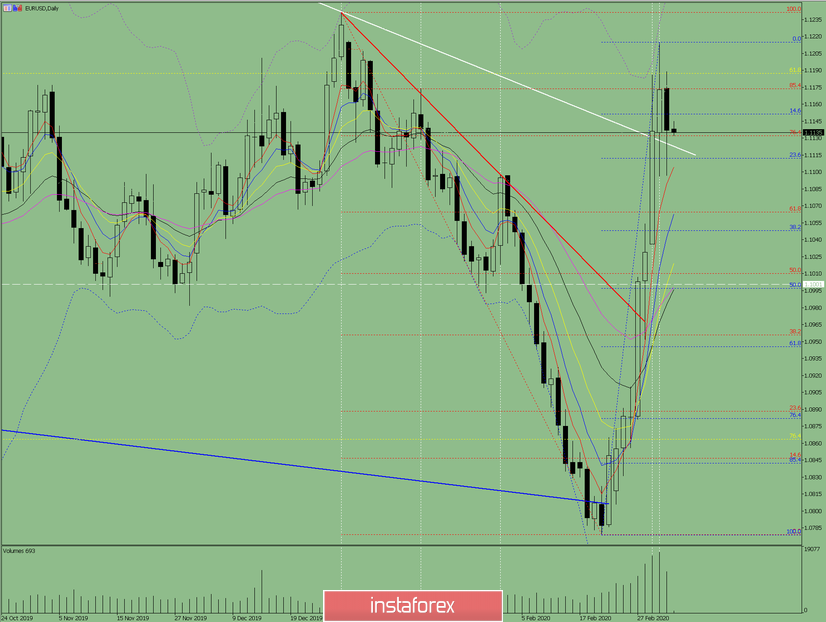
Fig. 1 (daily chart).
Comprehensive analysis:
- Indicator analysis - up;
- Fibonacci levels - up;
- Volumes - up;
- Candlestick analysis - down;
- Trend analysis - up;
- Bollinger Lines - up;
- Weekly schedule - up.
General conclusion:
Today, from the support line 1.1122 (white bold line) the price can continue to move up, with the target at the upper fractal 1.1215 (blue dashed line).
An unlikely scenario is from the support line of 1.1122 (white bold line), work down with the target of 1.1048, the retracement level of 38.2% (blue dashed line). Upon reaching this level, work up.