 English
  Русский
 Bahasa Indonesia
 Bahasa Malay
 ไทย
ไทย Español
 Deutsch
 Български
 Français
 Tiếng Việt
 中文
中文 বাংলা
বাংলা हिन्दी
 Čeština
 Українська
 Română

Trend analysis (Fig. 1).
Before the news today, the market may begin to move down from the upper fractal 1.1241 (red dashed line) with the target 1.1181, a retracement level of 14.6% (blue dashed line). Much will depend on the news. When the news is released, as per forecast, from the pullback level of 14.6% equivalent to 1.1181 (red dotted line), it is possible to move up.
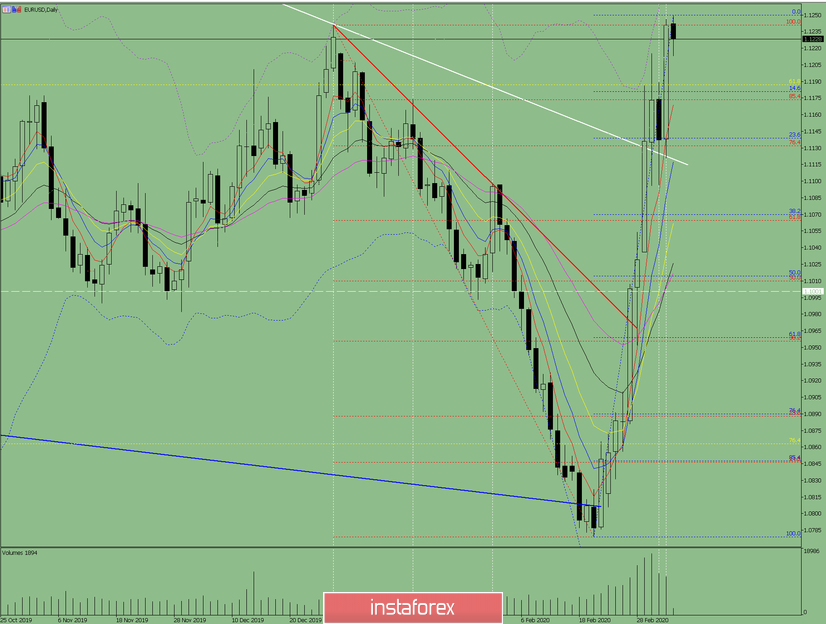
Fig. 1 (daily chart).
Comprehensive analysis:
- Indicator analysis - down;
- Fibonacci levels - down;
- Volumes - down;
- Candlestick analysis - down;
- Trend analysis - down;
- Bollinger lines - down;
- Weekly schedule - down.
General conclusion:
Today, from the upper fractal 1.1241 (red dashed line) the price may start moving down with the target 1.1181, a pullback level of 14.6% (blue dashed line).
An unlikely scenario is from a retracement level of 14.6% equivalent to 1.1181 (blue dashed line), work down with a target of 1.1139, a retracement level of 23.6% (blue dashed line).