 English
  Русский
 Bahasa Indonesia
 Bahasa Malay
 ไทย
ไทย Español
 Deutsch
 Български
 Français
 Tiếng Việt
 中文
中文 বাংলা
বাংলা हिन्दी
 Čeština
 Українська
 Română

Trend analysis (Fig. 1).
Before the news today, the price may attempt to reach the historical resistance level of 1.1292 (blue dotted line), although it is unlikely to succeed. During the news, it may begin to move up with the first target at the resistance line of 1.1346 (white bold line). From this line, it is possible to continue its upward movement with the target of 1.1458, a retracement level of 38.2% (red dashed line). And after the news, the continuation of the upward movemnet is with the first goal at the lower fractal 1.1252.
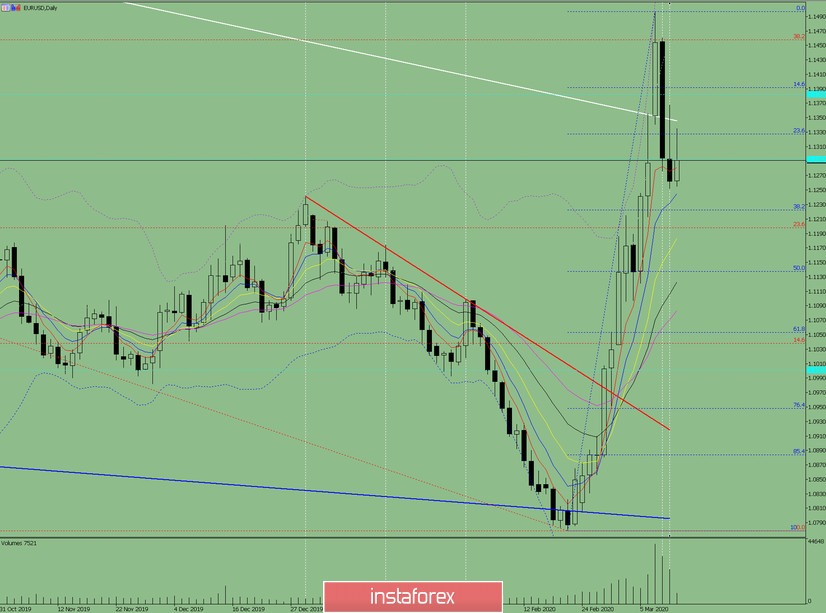
Fig. 1 (daily chart).
Comprehensive analysis:
- Indicator analysis - up;
- Fibonacci levels - up;
- Volumes - up;
- Candlestick analysis - down;
- Trend analysis - down;
- Bollinger Lines - up;
- Weekly schedule - up.
General conclusion:
Today, the price may start to move up.
An unlikely scenario: from the historical resistance level of 1.1292 (blue dashed line), work down with the target of 1.1223, a retracement level of 38.2% (blue dashed line).