 English
  Русский
 Bahasa Indonesia
 Bahasa Malay
 ไทย
ไทย Español
 Deutsch
 Български
 Français
 Tiếng Việt
 中文
中文 বাংলা
বাংলা हिन्दी
 Čeština
 Українська
 Română

Trend analysis (Fig. 1).
Today, the continuation of the downward movement is possible with another attempt to break through the retracement level of 61.8% equivalent to 1.1053 (blue dashed line). Upon reaching this level, the continuation of the upward movement is with the first target at the 21 average EMA of 1.1119 (black thin line).
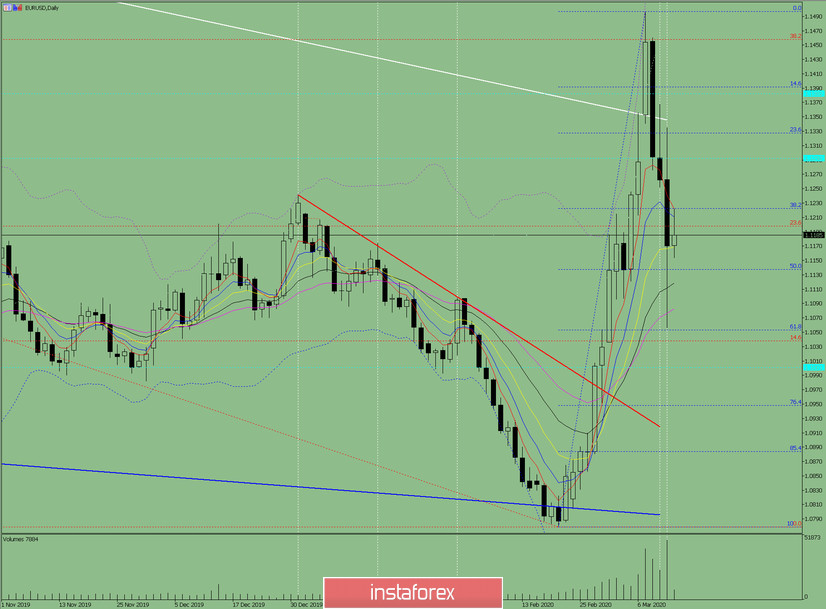
Fig. 1 (daily chart).
Comprehensive analysis:
- Indicator analysis - down;
- Fibonacci levels - down;
- Volumes - down;
- Candlestick analysis - up;
- Trend analysis - down;
- Bollinger Lines - up;
- Weekly schedule - down.
General conclusion:
Today, from the retracement level of 23.6% equivalent to 1.1198 (red dotted line) the price can start moving down with the first target at the lower fractal 1.1056 (blue bold line).
An unlikely scenario: from level 1.1170 (closing of the Thursday afternoon candle), work up with the target at the upper fractal 1.1335.