 English
  Русский
 Bahasa Indonesia
 Bahasa Malay
 ไทย
ไทย Español
 Deutsch
 Български
 Français
 Tiếng Việt
 中文
中文 বাংলা
বাংলা हिन्दी
 Čeština
 Українська
 Română

Trend analysis.
This week, the price will move upwards, towards the goal of 1.1196. There's a pullback level of 23.6% (blue dotted line). After reaching it, working upwards to the goal of 1.1331, the resistance line (red bold line), is also possible.
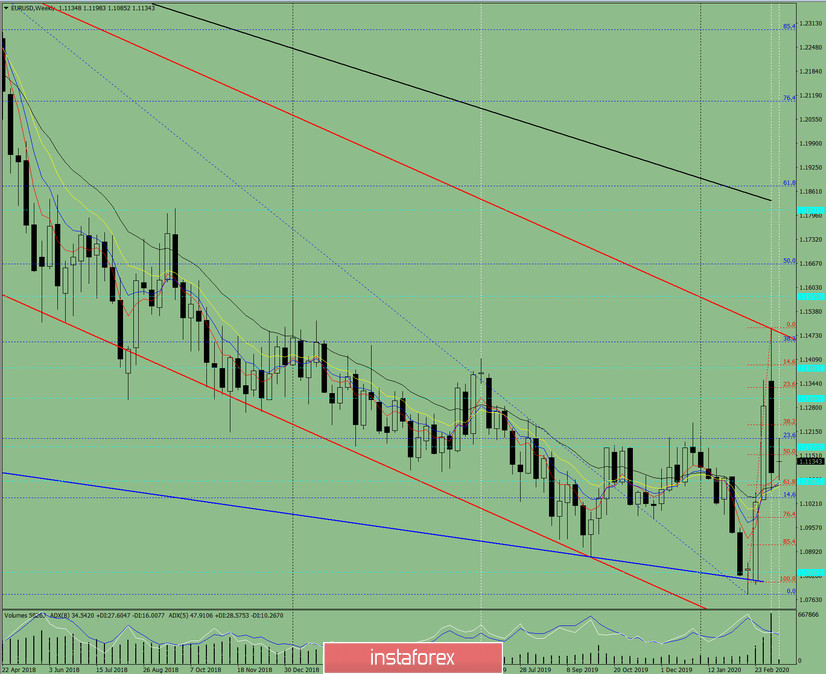
Fig 1 (weekly chart).
Complex analysis:
- Indicator analysis: up;
- Fibonacci levels: up;
- Volumes: up;
- Candlestick analysis: neutral;
- Trend analysis: down;
- Bollinger bands: up;
- Monthly chart: up.
The analysis indicates an upward movement.
The overall result of calculating the weekly candle of the EUR / USD pair: the price will have an upward trend this week, with the absence of the first lower shadow of the weekly white candle (Monday – up) and the absence of the second upper shadow (Friday – up).
Unlikely lower scenario: from the pullback level of 61.8% - 1.1072 (red dotted line), the price will move downwards to the lower target of 1.0984 – the pullback level of 76.4% (red dotted line).