 English
  Русский
 Bahasa Indonesia
 Bahasa Malay
 ไทย
ไทย Español
 Deutsch
 Български
 Français
 Tiếng Việt
 中文
中文 বাংলা
বাংলা हिन्दी
 Čeština
 Українська
 Română

USD/JPY
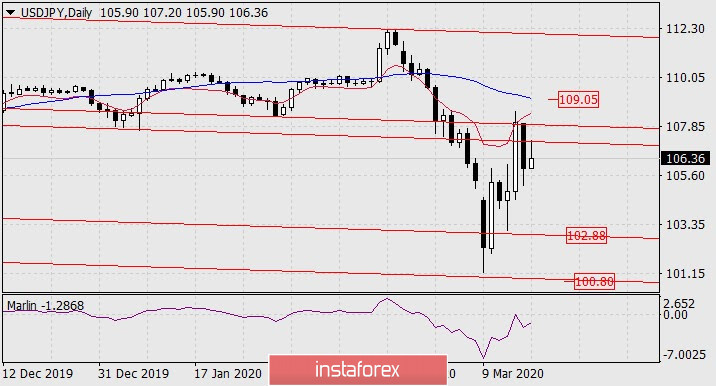
On Monday, following the fall of the US stock market by 11.98%(!), the USD/JPY dropped 205 points. The technical reversal occurred from the embedded line of the price channel. This morning, the price tested the lower line of the price channel from below and with the support of the Marlin oscillator, which is declining in the negative trend zone, it is heading deeper down.
On the four-hour chart, the price develops above the balance indicator lines (red) and the MACD (blue). The Marlin oscillator is close to the boundary with the territory of the bears, but has not yet penetrated it. The nearest support is the MACD line on the 104.70 level. Breaking the support opens the target of 102.88 on the embedded line of the price channel (daily).
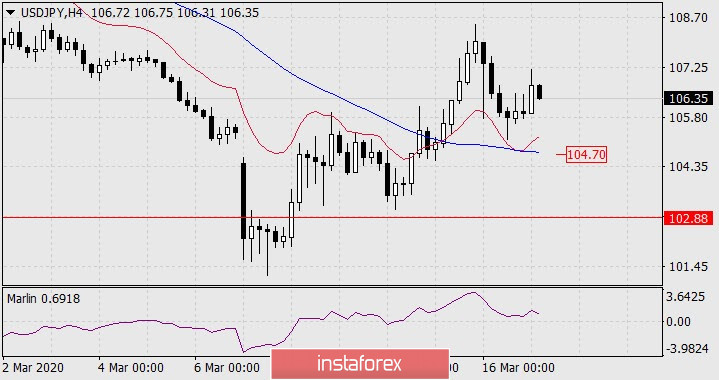
If the price is consolidated above the high of today's Asian session (above 107.30), which automatically means that the price goes above the price channel line on the daily chart, it can launch another round of growth to the MACD line on the daily scale – 109.05. The probability of such a scenario is 17-20%.