 English
  Русский
 Bahasa Indonesia
 Bahasa Malay
 ไทย
ไทย Español
 Deutsch
 Български
 Français
 Tiếng Việt
 中文
中文 বাংলা
বাংলা हिन्दी
 Čeština
 Українська
 Română

AUD/USD
The Australian dollar almost worked out the level of the Fibonacci reaction of 161.8% from the branch of the movement on December 31-February 28, which we see on the daily scale chart.
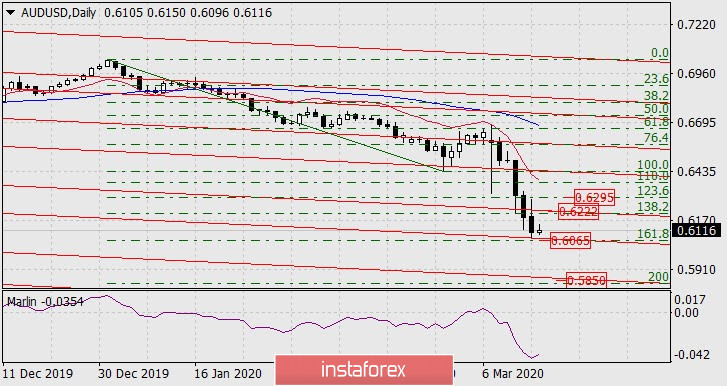
The Marlin oscillator slightly turned up and this could mean a subsequent price correction from a significant technical level. The nearest correction target is the area where the price channel line intersects with the Fibonacci level of 138.2% at the price of 0.6222. Breaking the level will open the second target for the 123.6% Fibonacci level at the price of 0.6295.
Leaving the price below 0.6065 will open a bearish target of 0.5850 – the area where the price channel line intersects with the 200.0% Fibonacci level.
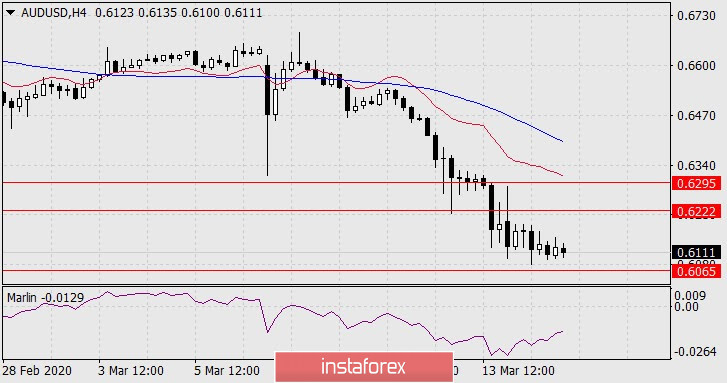
On the four-hour scale chart, the price is visually pressed down to the level of 0.6065 with the simultaneous upward reversal of the Marlin oscillator (it formed a mini-convergence), this is a sign of a sharp corrective rise in the price. Perhaps it will be limited to working out the 0.6222/95 range. There are no stronger conditions for a correction from external markets: iron ore is down by 0.38%, silver is cheaper by 0.55%, and copper by 0.17%.
Consolidating the price at 0.6065 opens the way for the aussie to the price channel line of 0.5850.